Runbook: Serial vs Parallel Redo in SQL Server
80 redo tests on two four-node SQL Server labs in Azure, Standard HDD and Ultra Disk: the scripts, the backlog-drain method, the real results, and why serial redo won one workload.
- Tested onSQL Server vNext CTP 1.2 on Linux (build 18.0.110.3), pre-release
- Redo modesParallel (default) and serial with trace flag 3459 (documented, global only)
- Toolssqlcmd · mssql-conf · Azure CLI
- Time27.5 hours of unattended tests over three days
- Cost8 Azure VMs in two labs; Ultra Disks bill while provisioned
- Scope80 measured runs in 13 scenarios, redo measured on node-4
Results at a glance
| Question | Lab result | Step |
|---|---|---|
| Is parallel redo always faster? | No serial won hot-tail inserts on Ultra Disk, 6 of 6 legs | 07 |
| Does serial redo win anywhere on slow disks? | No every scenario tied except random-key (parallel) | 06 |
| Does parallel win when apply work is heavy? | Confirmed random-key inserts: 4.5–6.2× (HDD), 1.4× (Ultra) | 06, 07 |
| Do workers block each other on a hot page? | Not what the data shows waits between workers 8 s or less | 08 |
| What limits parallel redo on hot-tail inserts? | The main redo thread 8.0–9.1 vs 6.1–7.0 ms CPU per MB | 08 |
| Can a normal run (no backlog) compare the modes? | No redo kept up in every mode, both labs | 04 |
| Did the disk matter? | Yes HDD capped the log at 27 MB/s; Ultra flush 0.9 ms | 03 |
| Does parallel redo stall after a restart? | Pattern only 4 of 13 legs on HDD, all soon after a restart | 06 |
| Do more cores remove the limit? | Not tested secondaries had 8 vCPUs, 4 workers | ★ |
Steps
- ▶Before you start
- 01Create the lab database and tables
- 02Set and verify the redo mode
- 03Measure what the disk lets the primary write
- 04Runs A to E: with no backlog, redo keeps up
- 05The backlog-drain method
- 06Lab 1 drains on Standard HDD: no serial win
- 07Lab 2 drains on Ultra Disk: serial wins hot-tail inserts
- 08Why parallel lost: one dispatching thread
- 09Test serial redo on one of your secondaries
- 99Clean up
- ★Recommendations
Before you start
What you need
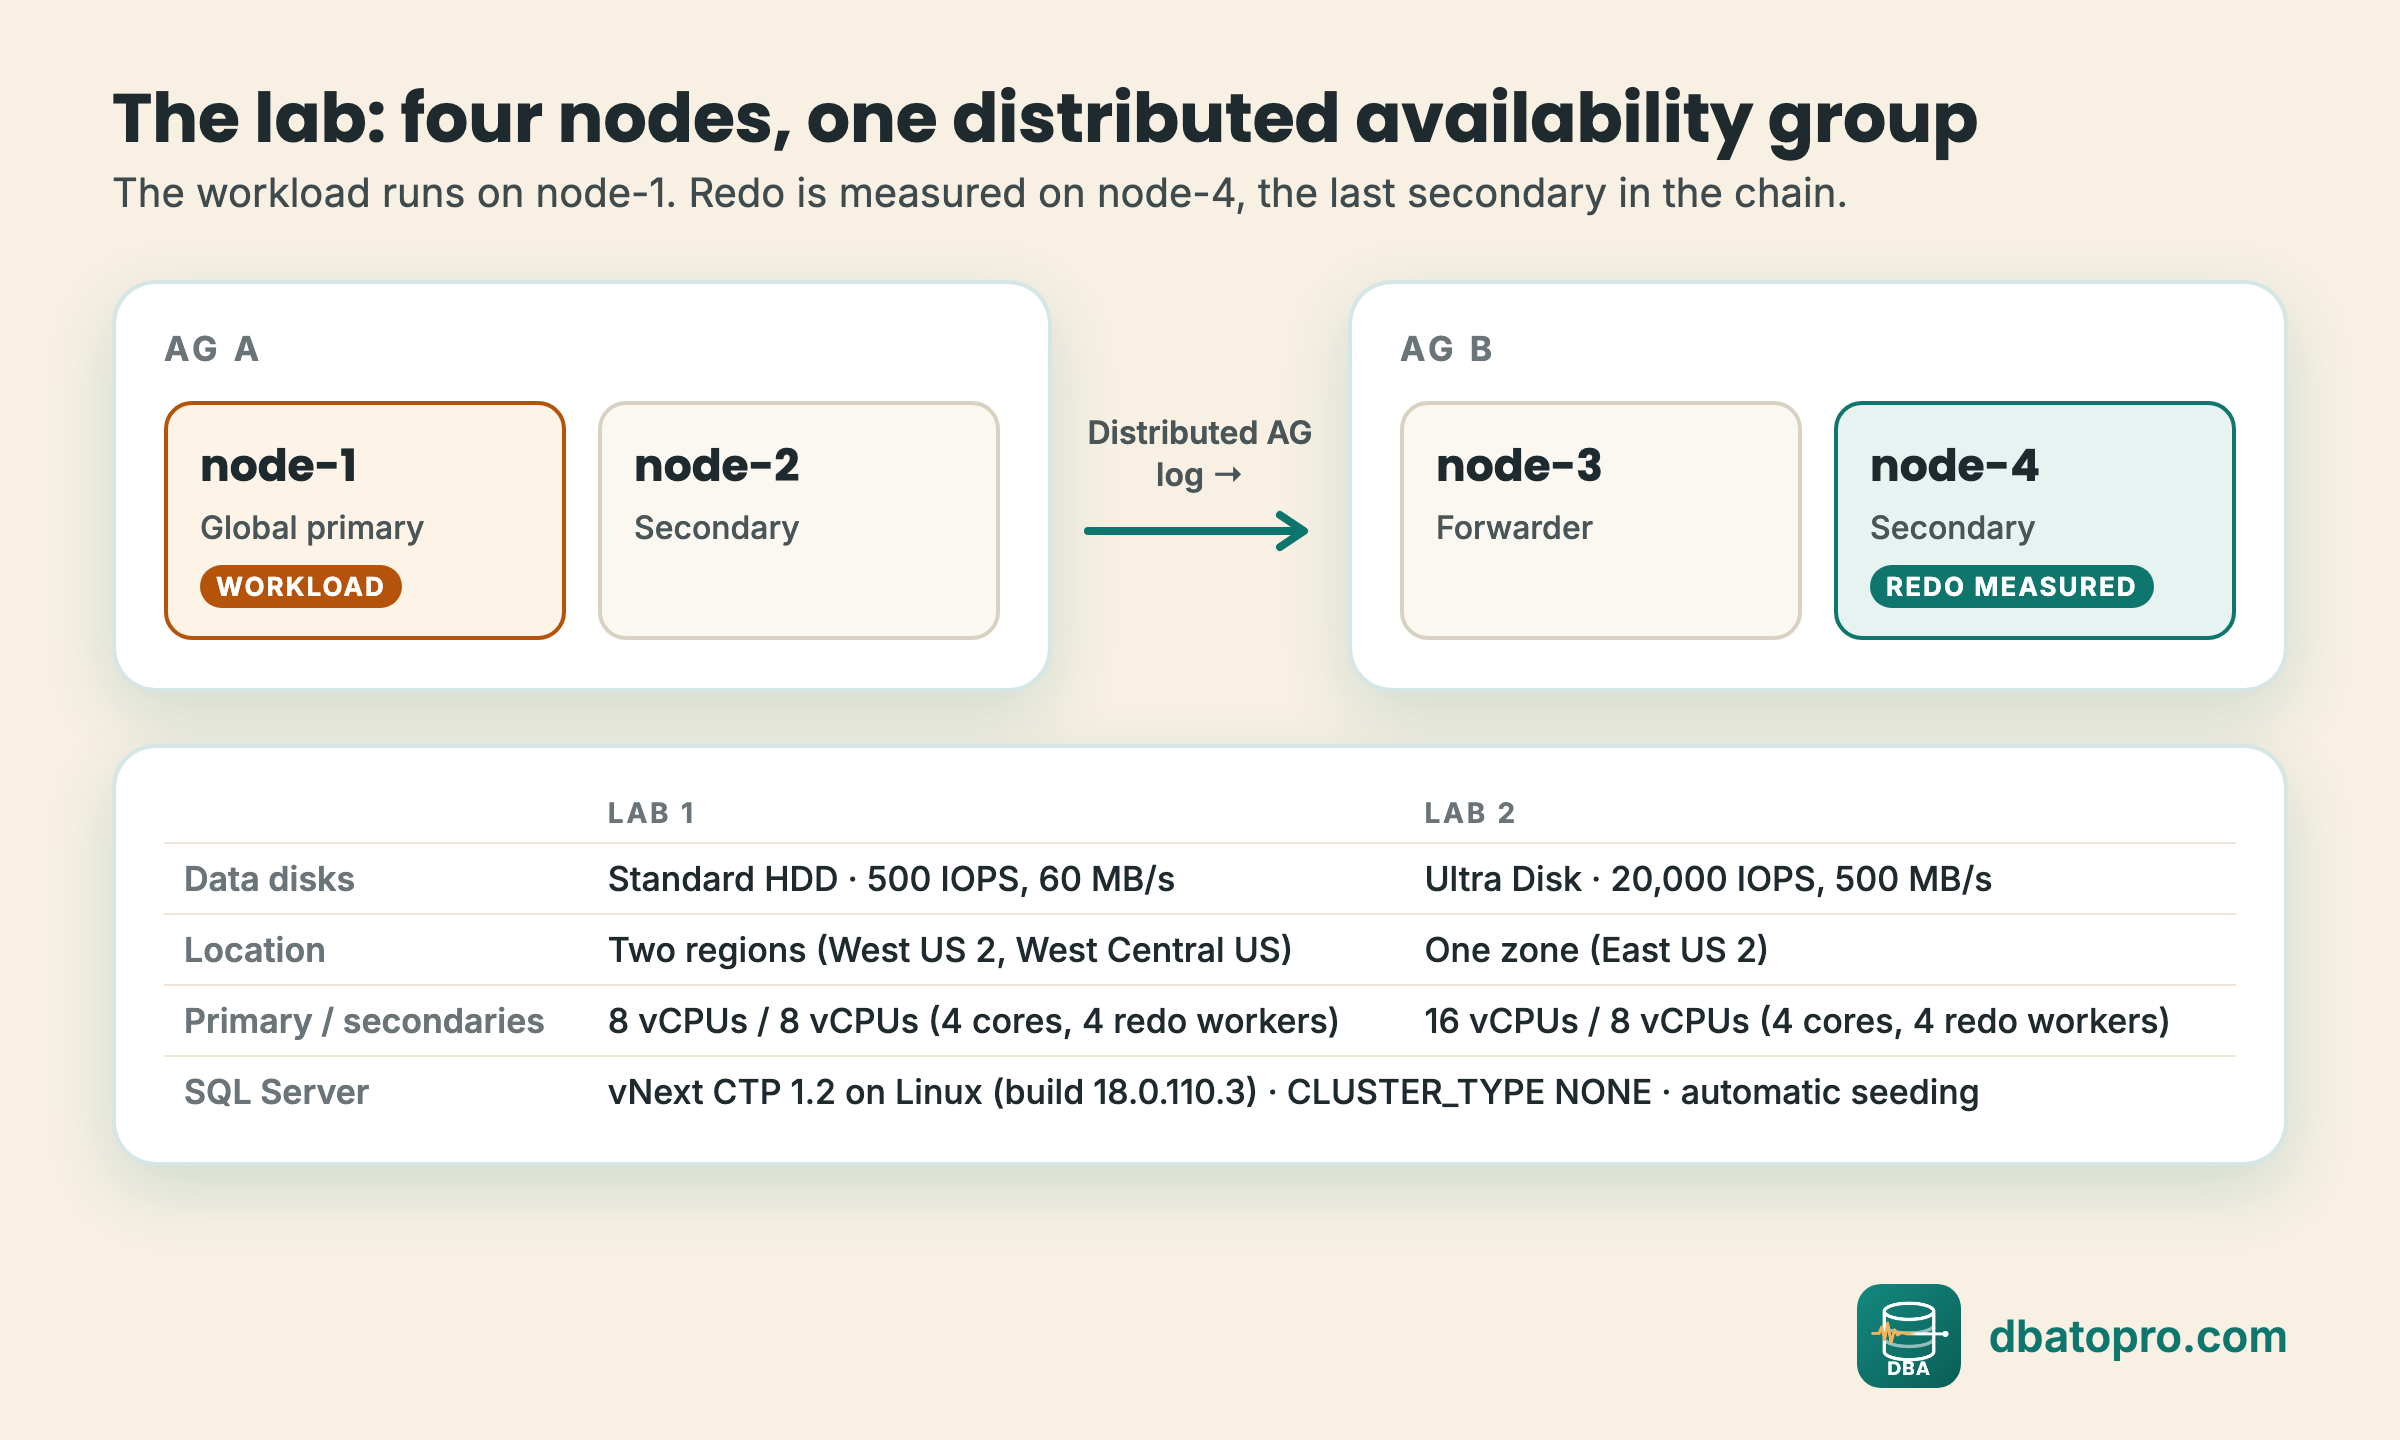
Four SQL Server on Linux VMs in two availability groups joined by a distributed availability group (CLUSTER_TYPE = NONE, certificate authentication, automatic seeding). sqlcmd on a machine that reaches port 1433 on every node, and root on the secondaries for mssql-conf.
Why this topology
Redo is measured on node-4, the last secondary in the chain, while node-1 only creates log. Pausing node-4 alone lets a backlog build without slowing the primary or the forwarder.
Set the connection variables
$ export PRIMARY=node-1 FORWARDER=node-3 SECONDARY=node-4
$ export SQL_USER=SA SQLCMDPASSWORD='<password>'   # same login on every replica
$ unzip dba-post-0005-lab.zip && cd dba-post-0005With Standard HDD data disks the log never passed 27 MB/s and redo was never the bottleneck. Lab 2 used Ultra Disk (512 GB, 20,000 IOPS, 500 MB/s, no host caching). Measure your log rate first (step 03).
Step 01: Create the lab database and tables
What this step does
Creates [dag-redo-lab] in FULL recovery, takes the base backup and adds it to AG A. Automatic seeding copies it to node-2 and, through the distributed AG, to node-3 and node-4. Then creates the tables for runs A to E and for scenarios H to M.
Why
Every redo test needs the same database on all four replicas, with tables built for one access pattern each: an identity key (hot tail), a GUID key (random pages), a 100-row table (churn), 8,000-byte rows (allocation) and 16 independent heaps (wide).
Run
$ sqlcmd -S "$PRIMARY" -U "$SQL_USER" -No -C -v AGNAME="<AG on node-1>" -i scripts/00_create_database.sql
$ sqlcmd -S "$PRIMARY" -U "$SQL_USER" -No -C -d dag-redo-lab -i scripts/01_workload_schema.sql
$ sqlcmd -S "$PRIMARY" -U "$SQL_USER" -No -C -i scripts/02_scenario_schema.sql
Script
scripts/00_create_database.sql
-- 00_create_database.sql
-- Run on: the global primary (node-1).
-- Creates the lab database [dag-redo-lab], sets FULL recovery, takes the base
-- full backup and adds it to the local availability group. With automatic
-- seeding on the AG and the distributed AG, it seeds to node-2 and, through the
-- forwarder (node-3), to node-4.
-- Usage: sqlcmd ... -i 00_create_database.sql -v AGNAME="<AG name on node-1>"

SET NOCOUNT ON;

IF DB_ID(N'dag-redo-lab') IS NOT NULL
BEGIN
    RAISERROR('Database [dag-redo-lab] already exists. Drop it first (99_cleanup.sql) if you want a clean start.', 16, 1);
    RETURN;
END;

CREATE DATABASE [dag-redo-lab];
ALTER DATABASE [dag-redo-lab] SET RECOVERY FULL;

-- A full backup is required before a database can join an AG.
BACKUP DATABASE [dag-redo-lab]
    TO DISK = N'/var/opt/mssql/data/dag-redo-lab-base.bak' WITH INIT, COMPRESSION;

ALTER AVAILABILITY GROUP [$(AGNAME)] ADD DATABASE [dag-redo-lab];

PRINT 'Created [dag-redo-lab] and added it to AG [$(AGNAME)].';
PRINT 'Wait for seeding to all three secondaries, then run 01_workload_schema.sql.';

-- Seeding and sync check (repeat until every replica is SYNCHRONIZED or SYNCHRONIZING):
SELECT DB_NAME(drs.database_id) AS db, ar.replica_server_name,
       drs.synchronization_state_desc, drs.log_send_queue_size, drs.redo_queue_size
FROM sys.dm_hadr_database_replica_states drs
JOIN sys.availability_replicas ar ON ar.replica_id = drs.replica_id
WHERE drs.database_id = DB_ID(N'dag-redo-lab');
scripts/01_workload_schema.sql
-- 01_workload_schema.sql
-- Run on: the global primary (node-1), database [dag-redo-lab].
-- Creates the source and target tables for runs A to E (bulk and single-row
-- inserts) and the marker table used to delimit runs.

USE [dag-redo-lab];
SET NOCOUNT ON;

-- Source for INSERT...SELECT bulk workload: 100,000 rows, ~220 bytes/row.
IF OBJECT_ID(N'dbo.seed_100k') IS NULL
BEGIN
    CREATE TABLE dbo.seed_100k (
        id        int           NOT NULL PRIMARY KEY,
        payload   char(200)     NOT NULL,
        created   datetime2     NOT NULL DEFAULT SYSUTCDATETIME()
    );
    INSERT dbo.seed_100k (id, payload)
    SELECT TOP (100000)
           ROW_NUMBER() OVER (ORDER BY (SELECT NULL)),
           REPLICATE(CHAR(65 + ABS(CHECKSUM(NEWID())) % 26), 200)
    FROM sys.all_columns a CROSS JOIN sys.all_columns b;
END;

-- Bulk target: heap + identity, one table shared by all 40 sessions.
IF OBJECT_ID(N'dbo.bulk_target') IS NULL
    CREATE TABLE dbo.bulk_target (
        row_id    bigint IDENTITY NOT NULL,
        session_n int             NOT NULL,
        src_id    int             NOT NULL,
        payload   char(200)       NOT NULL,
        inserted  datetime2       NOT NULL DEFAULT SYSUTCDATETIME()
    );

-- Atomic target: clustered PK, single-row autocommit inserts.
IF OBJECT_ID(N'dbo.atomic_target') IS NULL
    CREATE TABLE dbo.atomic_target (
        row_id    bigint IDENTITY NOT NULL PRIMARY KEY,
        session_n int             NOT NULL,
        payload   char(200)       NOT NULL,
        inserted  datetime2       NOT NULL DEFAULT SYSUTCDATETIME()
    );

-- Marker inserts (~1,000 rows after each run; see docs/run-book.md).
IF OBJECT_ID(N'dbo.run_marker') IS NULL
    CREATE TABLE dbo.run_marker (
        marker_id bigint IDENTITY NOT NULL PRIMARY KEY,
        run_label varchar(20)     NOT NULL,
        n         int             NOT NULL,
        utc_time  datetime2       NOT NULL DEFAULT SYSUTCDATETIME()
    );

PRINT 'Workload schema ready. Freeze the seed now: BACKUP DATABASE [dag-redo-lab] (see run-book).';
scripts/02_scenario_schema.sql
-- 02_scenario_schema.sql
-- Run on: the global primary (node-1). Idempotent.
-- Creates the tables for the backlog-drain scenarios H to L:
--   hot_tail (identity key), rand_key (GUID key), churn (100 rows),
--   alloc_churn (one 8,000-byte row per page) and wide_01..wide_16 (heaps).

USE [dag-redo-lab];
SET NOCOUNT ON;
IF OBJECT_ID(N'dbo.hot_tail') IS NULL
    CREATE TABLE dbo.hot_tail (id bigint IDENTITY(1,1) NOT NULL PRIMARY KEY CLUSTERED, payload char(200) NOT NULL);
IF OBJECT_ID(N'dbo.rand_key') IS NULL
    CREATE TABLE dbo.rand_key (id uniqueidentifier NOT NULL DEFAULT NEWID() PRIMARY KEY CLUSTERED, payload char(200) NOT NULL);
IF OBJECT_ID(N'dbo.churn') IS NULL
    CREATE TABLE dbo.churn (id int NOT NULL PRIMARY KEY CLUSTERED, counter bigint NOT NULL, payload char(200) NOT NULL);
IF OBJECT_ID(N'dbo.alloc_churn') IS NULL
    CREATE TABLE dbo.alloc_churn (session_n int NOT NULL, payload char(8000) NOT NULL);
DECLARE @i int = 1, @s nvarchar(400);
WHILE @i <= 16
BEGIN
    SET @s = N'IF OBJECT_ID(N''dbo.wide_' + RIGHT('0' + CAST(@i AS varchar(2)), 2) + N''') IS NULL CREATE TABLE dbo.wide_'
           + RIGHT('0' + CAST(@i AS varchar(2)), 2) + N' (session_n int NOT NULL, payload char(200) NOT NULL);';
    EXEC sys.sp_executesql @s;
    SET @i += 1;
END;
PRINT 'SCHEMA2_OK';
Results
The database seeded to all three secondaries in both labs. 02_scenario_schema.sql prints SCHEMA2_OK. In Lab 2 the database was pre-sized to a 24 GB log and 16 GB of data, so file growth never ran during a test.
Recommendation
Pre-size the data and log files before you measure anything. An autogrow in the middle of a leg shows up as a redo pause that has nothing to do with the redo mode.
Step 02: Set and verify the redo mode
What this step does
Turns trace flag 3459 on (serial) or off (parallel) with mssql-conf on every secondary and restarts SQL Server. After the restart, 11_verify_redo_mode.sql checks DBCC TRACESTATUS and lists the redo threads.
Why
A run is only worth something if you can prove which mode it ran in. The lab checked the flag on node-4 before every leg and saved the output.
Run
$ sudo ./scripts/10_set_redo_mode.sh serial          # on node-2, node-3 and node-4
$ sqlcmd -S "$SECONDARY" -U "$SQL_USER" -No -C -v EXPECT=serial -i scripts/11_verify_redo_mode.sql
Script
scripts/10_set_redo_mode.sh
#!/usr/bin/env bash
# 10_set_redo_mode.sh
# Run on: each secondary whose redo mode you set (node-2, node-3, node-4), as root.
# Trace flag 3459 is set as a startup flag with mssql-conf, then SQL Server is
# restarted. Never switch modes in the middle of a run. After the restart, wait
# for the AG and distributed AG to be healthy with empty queues, verify the mode
# with 11_verify_redo_mode.sql, and restart the DMV collector.
#
# Usage: sudo ./10_set_redo_mode.sh <parallel|serial>
set -euo pipefail

MODE="${1:?parallel | serial}"
CONF=/opt/mssql/bin/mssql-conf

case "$MODE" in
  parallel) $CONF traceflag 3459 off ;;   # default: parallel redo
  serial)   $CONF traceflag 3459 on  ;;   # TF 3459 disables parallel redo
  *) echo "Unknown mode: $MODE" >&2; exit 1 ;;
esac

systemctl restart mssql-server
echo "Mode '$MODE' set on $(hostname); SQL Server restarted."
echo "Next: wait for AG health and empty queues, then run 11_verify_redo_mode.sql."
scripts/11_verify_redo_mode.sql
-- 11_verify_redo_mode.sql
-- Run on: every measured secondary, after its last restart, before each run.
-- Serial redo requires TF 3459 with Status = 1 AND Global = 1. A run whose mode
-- can't be confirmed must not be used.
-- Usage: sqlcmd ... -i 11_verify_redo_mode.sql -v EXPECT="serial|parallel"

SELECT @@SERVERNAME AS server_name, SYSUTCDATETIME() AS utc_time, '$(EXPECT)' AS expected_mode;

DBCC TRACESTATUS(-1);

DECLARE @t TABLE (TraceFlag int, Status int, [Global] int, [Session] int);
INSERT @t EXEC ('DBCC TRACESTATUS(3459, -1) WITH NO_INFOMSGS');

DECLARE @s3459 int = ISNULL((SELECT Status * [Global] FROM @t WHERE TraceFlag = 3459), 0);

SELECT 'MODE_CHECK' AS what,
       CASE
         WHEN '$(EXPECT)' = 'serial'   AND @s3459 = 1 THEN 'PASS'
         WHEN '$(EXPECT)' = 'parallel' AND @s3459 = 0 THEN 'PASS'
         ELSE 'FAIL - do not use this run'
       END AS result,
       @s3459 AS tf3459_global;

-- With redo work in progress, the threads show the mode too:
-- serial = one DB STARTUP row; parallel = DB STARTUP plus PARALLEL REDO TASK rows.
SELECT r.session_id, r.command, r.wait_type, r.cpu_time
FROM sys.dm_exec_requests AS r
WHERE r.database_id = DB_ID(N'dag-redo-lab')
  AND (r.command = N'DB STARTUP' OR r.command LIKE N'%REDO%');
Results
| Evidence | Serial (leg Hs4) | Parallel (leg Hp4) |
|---|---|---|
DBCC TRACESTATUS(-1) on node-4 | 3459, Status 1, Global 1 | No flags listed |
Parallel redo worker statistics (Lab 1, redo_rca events) | None emitted: parallel redo is off | Work spread across 4 workers (e.g. 390,355 / 434,140 / 371,791 / 432,840 enqueues in run E1) |
Every mode switch was a restart with the flag set at startup. The lab never switched modes in the middle of a run.
Full output: results/tracestatus_Hs4__node-4.txt, results/tracestatus_Hp4__node-4.txt
Recommendation
- Check
Status = 1andGlobal = 1. A session-level flag does not change redo. - After each restart, wait until the AG and the distributed AG are healthy with empty queues, then restart the DMV collector, because the cumulative counters reset.
Step 03: Measure what the disk lets the primary write
What this step does
Runs the bulk and single-row workloads on node-1 while 20_log_rate_monitor.sql prints the log generation rate every 5 seconds, for each data disk type.
Why
Redo can only be tested when log arrives faster than redo can apply it. If the primary can't write log fast enough, both modes tie and you learn nothing.
Run
$ sqlcmd -S "$PRIMARY" -U "$SQL_USER" -No -C -i scripts/20_log_rate_monitor.sql   # in its own session
$ SQL_HOST="$PRIMARY" bash scripts/21_workload_runs_a_e.sh bulk cal1 40
Script
scripts/20_log_rate_monitor.sql
-- 20_log_rate_monitor.sql
-- Run on: the global primary, in its own session, while a workload runs.
-- Prints the log generation rate of [dag-redo-lab] every 5 seconds, from the
-- bytes written to the log file (file_id 2). This is how the disk calibration
-- numbers were measured.

SET NOCOUNT ON;
DECLARE @n int = 0, @prev bigint, @cur bigint, @t0 datetime2;
WHILE @n < 120   -- 10 minutes max
BEGIN
    SELECT @cur = num_of_bytes_written
    FROM sys.dm_io_virtual_file_stats(DB_ID(N'dag-redo-lab'), 2);  -- file_id 2 = log
    SET @t0 = SYSUTCDATETIME();
    IF @prev IS NOT NULL
        SELECT CONVERT(varchar(23), @t0, 126) AS utc_time,
               CAST((@cur - @prev) / 5.0 / 1048576.0 AS decimal(10,2)) AS log_mb_per_s;
    SET @prev = @cur;
    SET @n += 1;
    WAITFOR DELAY '00:00:05';
END;
Results
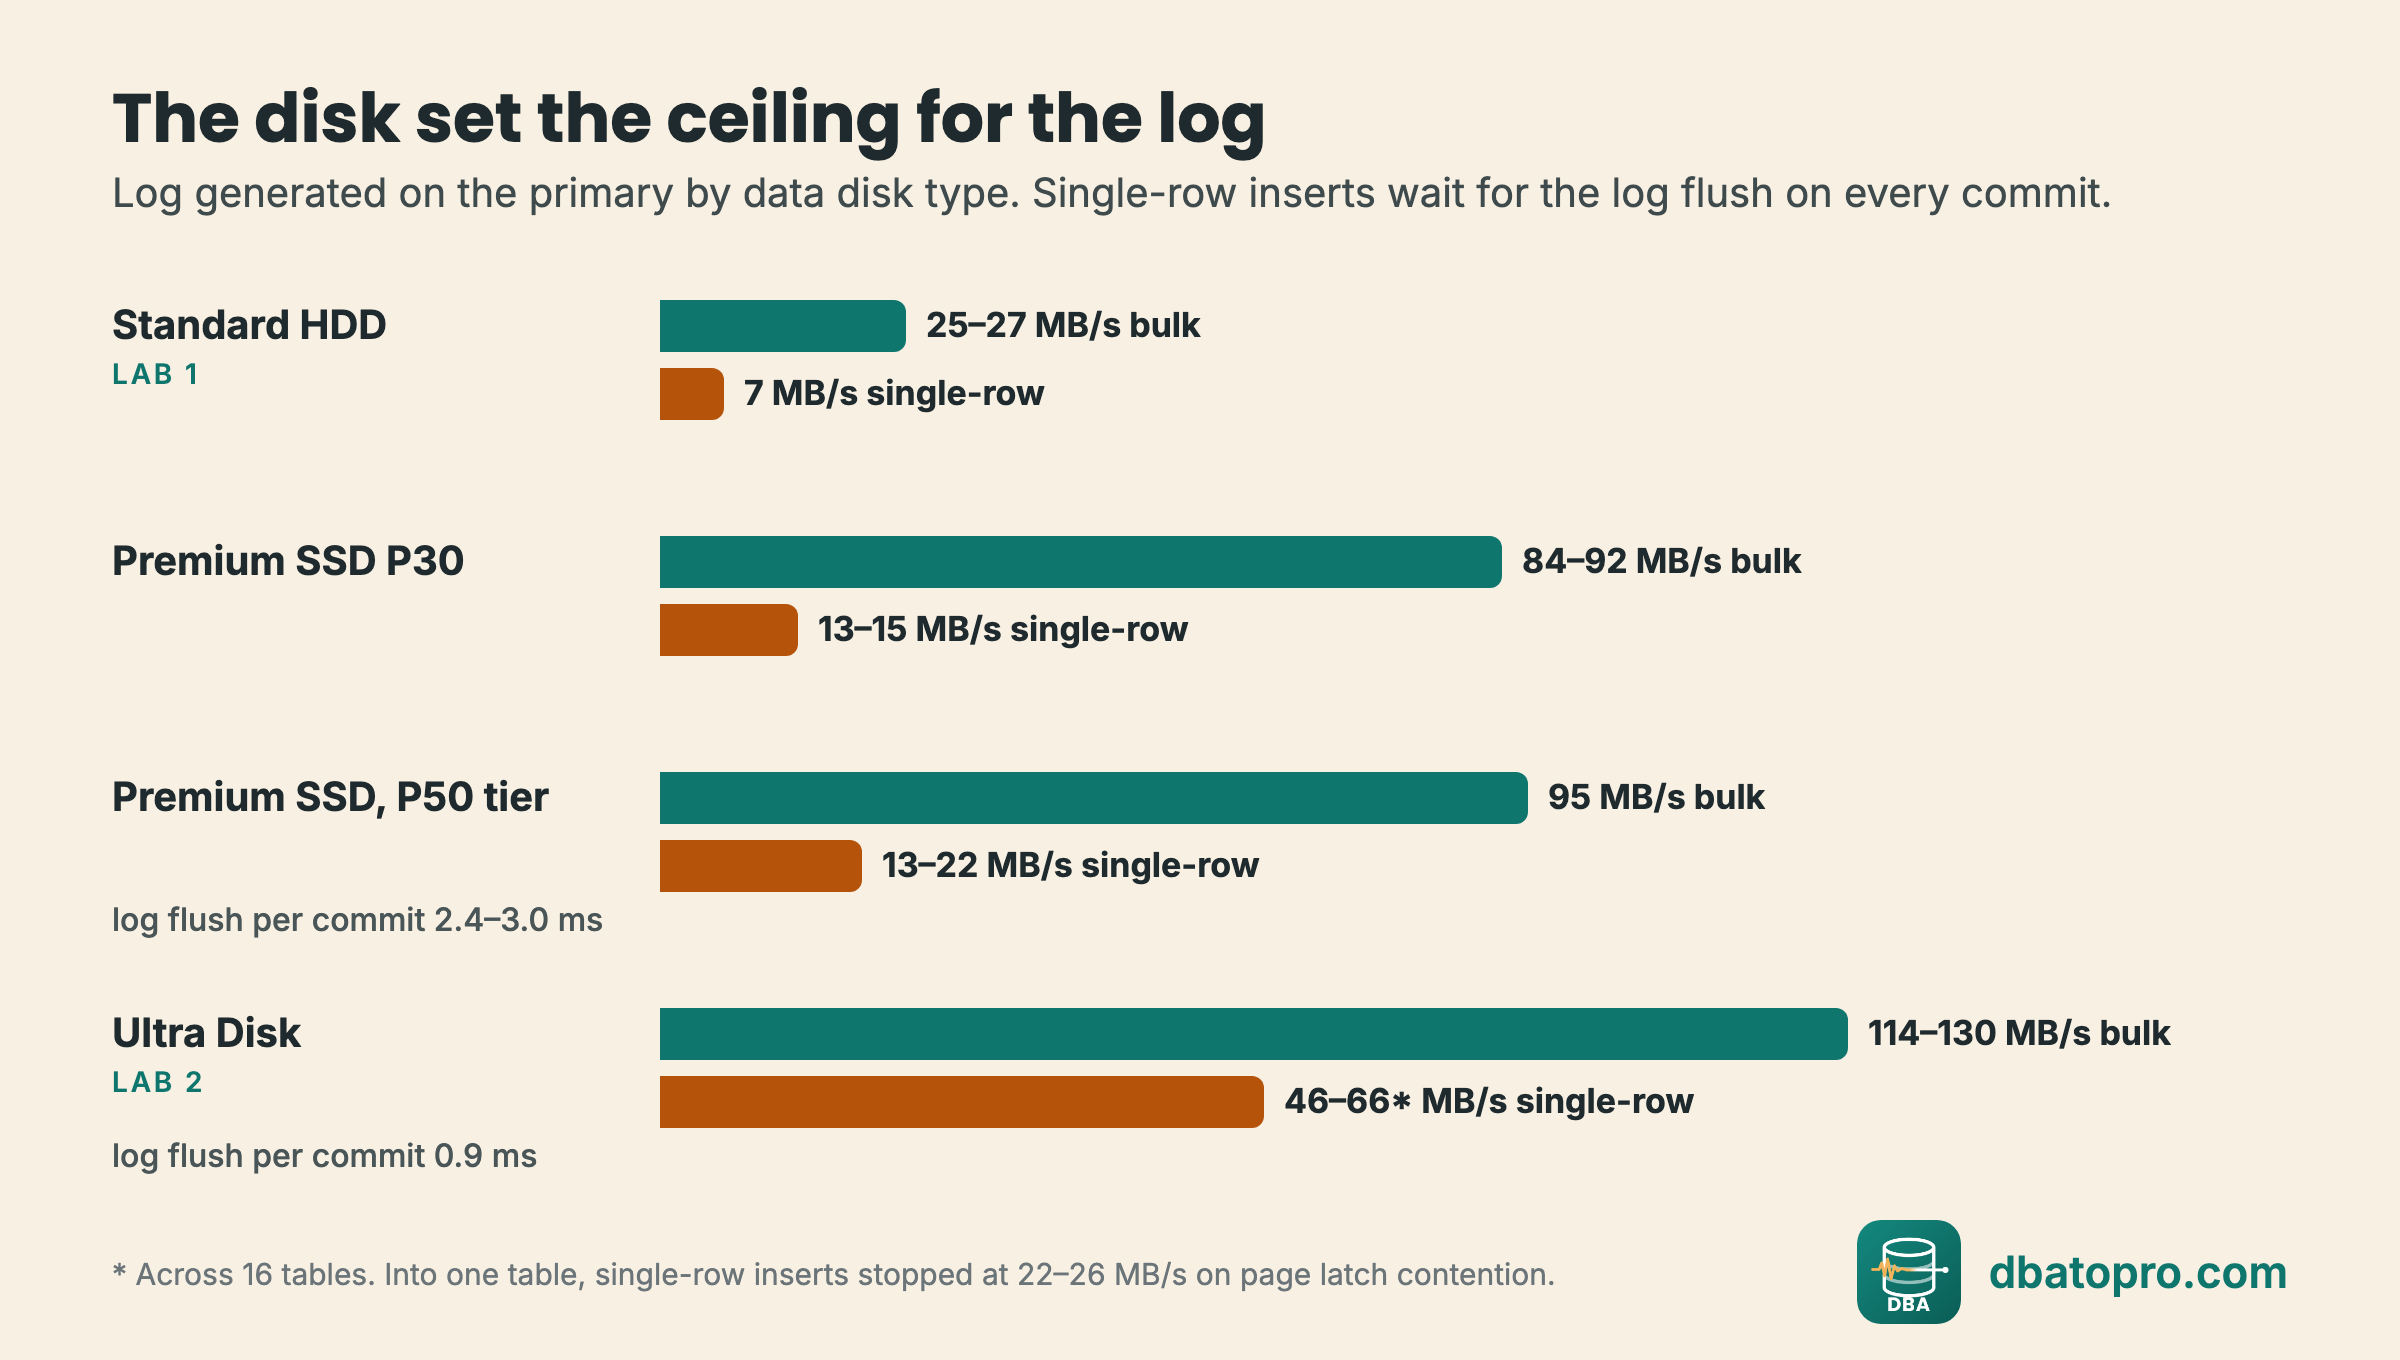
On Standard HDD the log never passed 27 MB/s, far below the 60 to 65 MB/s the test plan asked for. Ultra Disk cut the log flush per commit to 0.9 ms, about a third of Premium SSD at the P50 tier, so single-row inserts reached 46 to 66 MB/s across 16 tables.
Full output: results/storage_calibration.txt
Recommendation
In the lab subscription, a nightly automation turned Premium SSD disks back to Standard HDD, and disks deployed as Premium were found running as Standard HDD. That is the real reason Lab 1 couldn't reach the target rate.
Step 04: Runs A to E: with no backlog, redo keeps up
What this step does
Runs the bulk (40 × 100,000-row INSERT…SELECT), single-row (20 sessions) and high-rate (120 to 160 sessions) workloads in each mode, with the DMV collector running on every replica, and reads when node-4 finished redo.
Why
This was the original test plan. It shows what a normal comparison looks like: workload and redo at the same time.
Run
$ SQL_HOST="$PRIMARY" bash scripts/21_workload_runs_a_e.sh bulk A 40
$ SQL_HOST="$PRIMARY" bash scripts/21_workload_runs_a_e.sh atomic C 20 120
$ SQL_HOST="$PRIMARY" bash scripts/21_workload_runs_a_e.sh spread E1 160 180
$ sqlcmd -S "$SECONDARY" -U "$SQL_USER" -No -C -v MINUTES=480 -i scripts/40_dmv_collector.sql   # on every replica, own session
Script
scripts/21_workload_runs_a_e.sh
#!/usr/bin/env bash
# 21_workload_runs_a_e.sh
# Workloads for runs A to E. Runs against [dag-redo-lab] on the global primary.
#   bulk   = each session runs one INSERT...SELECT of 100,000 rows (runs A, B)
#   atomic = single-row autocommit inserts into one table with a clustered key (runs C, D)
#   spread = the same single-row inserts spread over the 16 dbo.wide_NN heaps, so the
#            log, not last-page latch contention on one table, limits the rate (run E)
# Usage: 21_workload_runs_a_e.sh <bulk|atomic|spread> <RUN> <SESSIONS> [DURATION_S] [START_EPOCH]
# Connection: SQL_HOST (default localhost), SQL_USER (default SA) and the password in
# SQLCMDPASSWORD. Writes $OUT/run_<RUN>.done with the start and end time (UTC).
set -u
SQLCMD=${SQLCMD:-/opt/mssql-tools18/bin/sqlcmd}
OUT=${OUT:-./results}; mkdir -p "$OUT"
KIND=$1; RUN=$2; S=$3; DUR=${4:-120}; T=${5:-0}
SQL(){ "$SQLCMD" -S "${SQL_HOST:-localhost}" -U "${SQL_USER:-SA}" -No -C -b -d dag-redo-lab "$@"; }

while [ "$(date +%s)" -lt "$T" ]; do sleep 1; done   # optional synchronized start
START=$(date -u +%Y-%m-%dT%H:%M:%SZ)

if [ "$KIND" = bulk ]; then
  for i in $(seq 1 "$S"); do
    SQL -Q "INSERT dbo.bulk_target (session_n, src_id, payload) SELECT $i, id, payload FROM dbo.seed_100k;" >/dev/null 2>&1 &
  done
elif [ "$KIND" = spread ]; then
  for i in $(seq 1 "$S"); do
    t=$(printf %02d $(( i % 16 + 1 )))
    SQL -Q "SET NOCOUNT ON; DECLARE @e datetime2=DATEADD(SECOND,$DUR,SYSUTCDATETIME()); WHILE SYSUTCDATETIME()<@e INSERT dbo.wide_$t(session_n,payload) VALUES($i,REPLICATE('x',200));" >/dev/null 2>&1 &
  done
else
  for i in $(seq 1 "$S"); do
    SQL -Q "SET NOCOUNT ON; DECLARE @e datetime2=DATEADD(SECOND,$DUR,SYSUTCDATETIME()); WHILE SYSUTCDATETIME()<@e INSERT dbo.atomic_target(session_n,payload) VALUES($i,REPLICATE('x',200));" >/dev/null 2>&1 &
  done
fi
wait
END=$(date -u +%Y-%m-%dT%H:%M:%SZ)
echo "RUN=$RUN START=$START END=$END" > "$OUT/run_${RUN}.done"
scripts/40_dmv_collector.sql
-- 40_dmv_collector.sql
-- Run on: every replica, each in its own sqlcmd session, before the first run.
-- Samples redo requests, replica states, file stats and replica counters every
-- second, and schedulers, waits, spinlocks, latches and memory every 5 seconds,
-- into the local RedoDiag database.
-- Usage: sqlcmd ... -i 40_dmv_collector.sql -v MINUTES=480
-- Cumulative DMVs (waits, latches, file stats) need before/after deltas per run,
-- and a SQL Server restart (every redo mode switch) resets them: restart this
-- collector after each restart.

IF DB_ID(N'RedoDiag') IS NULL
    CREATE DATABASE RedoDiag;
GO
USE RedoDiag;
GO
SET NOCOUNT ON;
DECLARE @minutes int = $(MINUTES);
DECLARE @q TABLE (name sysname, every_s int, txt nvarchar(max));
INSERT @q VALUES
(N'redo_requests', 1, N'
    SELECT r.session_id, r.command, r.database_id, r.cpu_time, r.total_elapsed_time,
           r.wait_type, r.wait_time, r.last_wait_type, r.scheduler_id,
           th.os_thread_id, t.context_switches_count
    FROM sys.dm_exec_requests AS r
    LEFT JOIN sys.dm_os_tasks AS t ON t.task_address = r.task_address
    LEFT JOIN sys.dm_os_workers AS w ON w.worker_address = t.worker_address
    LEFT JOIN sys.dm_os_threads AS th ON th.thread_address = w.thread_address
    WHERE r.database_id = DB_ID(N''dag-redo-lab'')
      AND (r.command = N''DB STARTUP'' OR r.command LIKE N''%REDO%'')'),
(N'hadr_db_replica_states', 1, N'
    SELECT database_id, replica_id, is_local, synchronization_state_desc,
           log_send_queue_size, log_send_rate, redo_queue_size, redo_rate,
           last_hardened_lsn, last_redone_lsn, last_redone_time
    FROM sys.dm_hadr_database_replica_states
    WHERE database_id = DB_ID(N''dag-redo-lab'')'),
(N'file_stats', 1, N'
    SELECT database_id, file_id, num_of_reads, num_of_bytes_read, io_stall_read_ms,
           num_of_writes, num_of_bytes_written, io_stall_write_ms
    FROM sys.dm_io_virtual_file_stats(DB_ID(N''dag-redo-lab''), NULL)'),
(N'perf_counters', 1, N'
    SELECT RTRIM(object_name) AS object_name, RTRIM(counter_name) AS counter_name,
           RTRIM(instance_name) AS instance_name, cntr_value, cntr_type
    FROM sys.dm_os_performance_counters
    WHERE object_name LIKE N''%Database Replica%''
       OR object_name LIKE N''%Availability Replica%''
       OR (object_name LIKE N''%:Databases%'' AND instance_name = N''dag-redo-lab'')'),
(N'schedulers', 5, N'
    SELECT scheduler_id, cpu_id, status, total_cpu_usage_ms, total_scheduler_delay_ms,
           runnable_tasks_count, current_tasks_count, context_switches_count
    FROM sys.dm_os_schedulers
    WHERE scheduler_id < 1048576'),
(N'wait_stats', 5, N'
    SELECT wait_type, waiting_tasks_count, wait_time_ms, max_wait_time_ms, signal_wait_time_ms
    FROM sys.dm_os_wait_stats
    WHERE waiting_tasks_count > 0'),
(N'spinlock_stats', 5, N'
    SELECT name, collisions, spins, spins_per_collision, sleep_time, backoffs
    FROM sys.dm_os_spinlock_stats
    WHERE spins > 0'),
(N'latch_stats', 5, N'
    SELECT latch_class, waiting_requests_count, wait_time_ms, max_wait_time_ms
    FROM sys.dm_os_latch_stats
    WHERE waiting_requests_count > 0'),
(N'rg_pools', 5, N'
    SELECT pool_id, name, total_cpu_usage_ms, total_cpu_delayed_ms, total_cpu_active_ms,
           total_cpu_violation_delay_ms
    FROM sys.dm_resource_governor_resource_pools'),
(N'rg_groups', 5, N'
    SELECT group_id, name, pool_id, total_cpu_usage_ms, total_request_count, active_request_count
    FROM sys.dm_resource_governor_workload_groups'),
(N'memory_clerks', 5, N'
    SELECT type, SUM(pages_kb) AS pages_kb
    FROM sys.dm_os_memory_clerks
    GROUP BY type
    HAVING SUM(pages_kb) > 0');

DECLARE @end datetime2 = DATEADD(MINUTE, @minutes, SYSUTCDATETIME());
DECLARE @i int = 0, @name sysname, @every int, @txt nvarchar(max), @sql nvarchar(max);
WHILE SYSUTCDATETIME() < @end
BEGIN
    DECLARE c CURSOR LOCAL FAST_FORWARD FOR SELECT name, every_s, txt FROM @q;
    OPEN c;
    FETCH NEXT FROM c INTO @name, @every, @txt;
    WHILE @@FETCH_STATUS = 0
    BEGIN
        IF @i % @every = 0
        BEGIN
            SET @sql = CASE
                WHEN OBJECT_ID(N'dbo.' + @name) IS NULL
                    THEN N'SELECT SYSUTCDATETIME() AS sample_time_utc, q.* INTO dbo.' + QUOTENAME(@name) + N' FROM (' + @txt + N') AS q;'
                ELSE N'INSERT dbo.' + QUOTENAME(@name) + N' SELECT SYSUTCDATETIME(), q.* FROM (' + @txt + N') AS q;'
            END;
            -- TRY/CATCH so a compile error in one source (e.g. a column missing
            -- on this build) cannot abort the whole collector batch.
            BEGIN TRY
                EXEC sys.sp_executesql @sql;
            END TRY
            BEGIN CATCH
                IF @i = 0 PRINT CONCAT(N'source ', @name, N' failed: ', ERROR_MESSAGE());
            END CATCH;
        END;
        FETCH NEXT FROM c INTO @name, @every, @txt;
    END;
    CLOSE c;
    DEALLOCATE c;
    SET @i += 1;
    WAITFOR DELAY '00:00:01';
END;
Results
| Lab 1 · Standard HDD | Lab 2 · Ultra Disk | |
|---|---|---|
| Log rate | up to 27 MB/s bulk; about 7 MB/s at 120 sessions | 130 to 159 MB/s bulk; 65 to 66 MB/s at 160 sessions |
| Redo finished after the workload | 0 to 4 s in every mode (one outlier, run C: 32.7 s; its repeat 1.0 s) | within 2 s; at 65 MB/s the queue never went above 32 MB |
| Reading | Tie | Tie |
The lab also ran a third mode in runs F and G: parallel redo without the thread pool, set with two trace flags that are not publicly documented. It behaved like the default parallel mode, so its numbers are left out.
Full output: results/lab1_runs_a_e.txt, results/lab2_runs_a_e.txt
Recommendation
A tie here is not a parallel win. It means redo was never the bottleneck, so the test could not tell the modes apart. Move to the backlog-drain method (step 05).
Step 05: The backlog-drain method
What this step does
For each leg: reset the tables, SET HADR SUSPEND on node-4, run the workload on node-1 until it ends, wait until node-3 has caught up, then SET HADR RESUME on node-4 and sample every 500 ms until the received and redone byte counters stop with an empty queue.
Why
Pausing node-4 builds a backlog of several GB. When it resumes, redo is the only thing left to measure: the drain time is redo capacity, not workload speed.
Run
$ ./run_leg.sh Hs1 H # reset, suspend, workload, wait for node-3, resume and time the drainScript
run_leg.sh
#!/usr/bin/env bash
# run_leg.sh: one backlog-drain leg, the same steps the lab's orchestrator ran.
#   1. reset the scenario tables on the primary (03_scenario_reset.sql)
#   2. record the trace flags on the measured secondary
#   3. SUSPEND data movement on the measured secondary
#   4. run the workload on the primary until it ends (log piles up)
#   5. wait until the forwarder has caught up (redo and send queues under 1 MB)
#   6. RESUME on the measured secondary and time the drain (31_drain_measure.sql)
# Set the redo mode first (10_set_redo_mode.sh + 11_verify_redo_mode.sql on the secondaries).
#
# Usage: ./run_leg.sh <RUN> <H|I|J|K|L|M> [DUR_S]      e.g. ./run_leg.sh Hs1 H
# Needs: PRIMARY, FORWARDER, SECONDARY (host names sqlcmd can reach), SQL_USER (default SA)
#        and the password in SQLCMDPASSWORD (the same login on every replica).
set -euo pipefail
cd "$(dirname "$0")"
RUN=$1; SCN=$2; DUR=${3:-300}
: "${PRIMARY:?set PRIMARY}" "${FORWARDER:?set FORWARDER}" "${SECONDARY:?set SECONDARY}"
SQLCMD=${SQLCMD:-sqlcmd}
export OUT=./results; mkdir -p "$OUT"
SQ(){ local h=$1; shift; "$SQLCMD" -S "$h" -U "${SQL_USER:-SA}" -No -C -b "$@"; }
QUEUES="SET NOCOUNT ON; SELECT ISNULL(MAX(ISNULL(redo_queue_size,0)+ISNULL(log_send_queue_size,0)),0)
        FROM sys.dm_hadr_database_replica_states WHERE is_local=1 AND database_id=DB_ID(N'dag-redo-lab');"

echo "== $RUN: reset"
SQ "$PRIMARY" -i scripts/03_scenario_reset.sql | grep -q RESET_OK

echo "== $RUN: trace flags on the measured secondary"
SQ "$SECONDARY" -Q "SELECT @@SERVERNAME, SYSUTCDATETIME(); DBCC TRACESTATUS(-1);" > "$OUT/tracestatus_${RUN}.txt"

echo "== $RUN: suspend data movement on $SECONDARY"
SQ "$SECONDARY" -Q "ALTER DATABASE [dag-redo-lab] SET HADR SUSPEND;"

echo "== $RUN: workload $SCN on $PRIMARY"
SQL_HOST="$PRIMARY" SQLCMD="$SQLCMD" bash scripts/30_workload_scenarios_h_m.sh "$SCN" "$RUN" "$DUR"
cat "$OUT/run_${RUN}.done"
LOGMB=$(grep -o 'LOGMB=[0-9]*' "$OUT/run_${RUN}.done" | cut -d= -f2)

echo "== $RUN: wait for $FORWARDER to catch up"
until [ "$(SQ "$FORWARDER" -h -1 -W -Q "$QUEUES" | tr -dc 0-9)" -le 1024 ]; do sleep 10; done

echo "== $RUN: resume and time the drain on $SECONDARY"
SQ "$SECONDARY" -I -i scripts/31_drain_measure.sql -v RUN="$RUN" MINMB=$(( ${LOGMB:-0} / 2 )) > "$OUT/drain_${RUN}.txt" 2>&1
grep DRAIN_SUMMARY "$OUT/drain_${RUN}.txt"
scripts/03_scenario_reset.sql
-- 03_scenario_reset.sql
-- Run on: the global primary (node-1), before every drain leg.
-- Empties the scenario tables, reseeds churn with 100 rows, and takes a log
-- backup so each leg starts from the same state and the log can be reused.

USE [dag-redo-lab];
SET NOCOUNT ON;
TRUNCATE TABLE dbo.hot_tail;
TRUNCATE TABLE dbo.rand_key;
TRUNCATE TABLE dbo.alloc_churn;
TRUNCATE TABLE dbo.bulk_target;
TRUNCATE TABLE dbo.atomic_target;
TRUNCATE TABLE dbo.churn;
INSERT dbo.churn (id, counter, payload)
SELECT TOP (100) ROW_NUMBER() OVER (ORDER BY (SELECT NULL)), 0, REPLICATE('a', 200) FROM sys.all_columns;
DECLARE @i int = 1, @s nvarchar(200);
WHILE @i <= 16
BEGIN
    SET @s = N'TRUNCATE TABLE dbo.wide_' + RIGHT('0' + CAST(@i AS varchar(2)), 2) + N';';
    EXEC sys.sp_executesql @s;
    SET @i += 1;
END;
BACKUP LOG [dag-redo-lab] TO DISK = N'/var/opt/mssql/data/dag-redo-lab-log.trn' WITH INIT, COMPRESSION;
PRINT 'RESET_OK';
scripts/30_workload_scenarios_h_m.sh
#!/usr/bin/env bash
# 30_workload_scenarios_h_m.sh
# Workloads for the backlog-drain scenarios. Runs against [dag-redo-lab] on the global primary.
#   H  hot-tail inserts:   60 sessions, single-row inserts on an identity key, DUR seconds
#   I  random-key inserts: 60 sessions, single-row inserts on a GUID key, DUR seconds
#   J  update churn:       40 sessions, updates on a random row of a 100-row table, DUR seconds
#   K  allocation-heavy:   20 sessions x 90 loops of insert 50 x 8,000-byte rows, then delete them
#   L  wide inserts:       32 sessions x 9 loops of 20,000-row INSERT...SELECT into wide_01..16
#   M  bulk insert:        40 sessions x one 100,000-row INSERT...SELECT
# Usage: 30_workload_scenarios_h_m.sh <H|I|J|K|L|M> <RUN> [DUR_S, default 300]
# Connection: SQL_HOST (default localhost), SQL_USER (default SA) and the password in
# SQLCMDPASSWORD. Writes $OUT/run_<RUN>.done with START/END (UTC) and LOGMB, the log
# written during the leg (from sys.dm_io_virtual_file_stats).
set -u
SQLCMD=${SQLCMD:-/opt/mssql-tools18/bin/sqlcmd}
OUT=${OUT:-./results}; mkdir -p "$OUT"
SCN=$1; RUN=$2; DUR=${3:-300}
SQL(){ "$SQLCMD" -S "${SQL_HOST:-localhost}" -U "${SQL_USER:-SA}" -No -C -b -d dag-redo-lab "$@"; }
LOGB(){ SQL -h -1 -W -Q "SET NOCOUNT ON; SELECT num_of_bytes_written FROM sys.dm_io_virtual_file_stats(DB_ID(),2);" | tr -dc 0-9; }

B=$(LOGB)
START=$(date -u +%Y-%m-%dT%H:%M:%SZ)
case $SCN in
  H) for i in $(seq 1 60); do
       SQL -Q "SET NOCOUNT ON; DECLARE @e datetime2=DATEADD(SECOND,$DUR,SYSUTCDATETIME()); WHILE SYSUTCDATETIME()<@e INSERT dbo.hot_tail(payload) VALUES(REPLICATE('x',200));" >/dev/null 2>&1 &
     done ;;
  I) for i in $(seq 1 60); do
       SQL -Q "SET NOCOUNT ON; DECLARE @e datetime2=DATEADD(SECOND,$DUR,SYSUTCDATETIME()); WHILE SYSUTCDATETIME()<@e INSERT dbo.rand_key(payload) VALUES(REPLICATE('x',200));" >/dev/null 2>&1 &
     done ;;
  J) for i in $(seq 1 40); do
       SQL -Q "SET NOCOUNT ON; DECLARE @e datetime2=DATEADD(SECOND,$DUR,SYSUTCDATETIME()), @id int; WHILE SYSUTCDATETIME()<@e BEGIN SET @id=1+ABS(CHECKSUM(NEWID()))%100; UPDATE dbo.churn SET counter+=1, payload=REPLICATE(CHAR(65+@id%26),200) WHERE id=@id; END" >/dev/null 2>&1 &
     done ;;
  K) for i in $(seq 1 20); do
       SQL -Q "SET NOCOUNT ON; DECLARE @n int=0; WHILE @n<90 BEGIN INSERT dbo.alloc_churn(session_n,payload) SELECT TOP(50) $i, REPLICATE('x',8000) FROM dbo.seed_100k; DELETE dbo.alloc_churn WHERE session_n=$i; SET @n+=1; END" >/dev/null 2>&1 &
     done ;;
  L) for i in $(seq 1 32); do
       t=$(printf %02d $(( i % 16 + 1 )))
       SQL -Q "SET NOCOUNT ON; DECLARE @n int=0; WHILE @n<9 BEGIN INSERT dbo.wide_$t(session_n,payload) SELECT TOP(20000) $i, payload FROM dbo.seed_100k; SET @n+=1; END" >/dev/null 2>&1 &
     done ;;
  M) for i in $(seq 1 40); do
       SQL -Q "INSERT dbo.bulk_target (session_n, src_id, payload) SELECT $i, id, payload FROM dbo.seed_100k;" >/dev/null 2>&1 &
     done ;;
  *) echo "Unknown scenario: $SCN" >&2; exit 1 ;;
esac
wait
END=$(date -u +%Y-%m-%dT%H:%M:%SZ)
A=$(LOGB)
echo "RUN=$RUN START=$START END=$END LOGMB=$(( (A-B)/1048576 ))" > "$OUT/run_${RUN}.done"
scripts/31_drain_measure.sql
-- 31_drain_measure.sql
-- Run on: the measured secondary (node-4), with data movement SUSPENDED and the
-- backlog already built. Resumes data movement and samples every 500 ms until
-- the received and redone byte counters are stable with an empty redo queue.
-- Usage: sqlcmd ... -I -i 31_drain_measure.sql -v RUN=Hs1 MINMB=<half the log MB of the leg>
-- Prints one line: DRAIN_SUMMARY|run|redone_mb|recv_mb|start_ms|recv_ms|drain_ms|peak_queue_kb|redo_mb_s

SET NOCOUNT ON;
IF DB_ID(N'RedoDiag') IS NULL CREATE DATABASE RedoDiag;
GO
USE RedoDiag;
SET NOCOUNT ON;
IF OBJECT_ID(N'dbo.drain_samples') IS NULL
    CREATE TABLE dbo.drain_samples (run varchar(12) NOT NULL, ms int NOT NULL, redo_queue_kb bigint,
        redo_rate_kbs bigint, recv_bytes bigint, redone_bytes bigint, sync_state varchar(30));
DELETE dbo.drain_samples WHERE run = '$(RUN)';

DECLARE @t0 datetime2 = SYSUTCDATETIME(), @ms int = 0, @stable int = 0,
        @q bigint, @rate bigint, @recv bigint, @redone bigint, @st varchar(30),
        @precv bigint = -1, @predone bigint = -1;
DECLARE @b0 bigint = (SELECT MAX(cntr_value) FROM sys.dm_os_performance_counters
    WHERE object_name LIKE N'%Database Replica%' AND instance_name = N'dag-redo-lab'
      AND counter_name LIKE N'Log Bytes Received/sec%');
-- AG DDL is only permitted from master
EXEC master.sys.sp_executesql N'ALTER DATABASE [dag-redo-lab] SET HADR RESUME;';
WHILE @stable < 20 AND @ms < 1800000
BEGIN
    SELECT @q = ISNULL(redo_queue_size,0), @rate = ISNULL(redo_rate,0), @st = synchronization_state_desc
    FROM sys.dm_hadr_database_replica_states
    WHERE is_local = 1 AND database_id = DB_ID(N'dag-redo-lab');
    SELECT @recv   = MAX(CASE WHEN counter_name LIKE N'Log Bytes Received/sec%' THEN cntr_value END),
           @redone = MAX(CASE WHEN counter_name LIKE N'Redone Bytes/sec%' THEN cntr_value END)
    FROM sys.dm_os_performance_counters
    WHERE object_name LIKE N'%Database Replica%' AND instance_name = N'dag-redo-lab';
    SET @ms = DATEDIFF(MILLISECOND, @t0, SYSUTCDATETIME());
    INSERT dbo.drain_samples VALUES ('$(RUN)', @ms, @q, @rate, @recv, @redone, @st);
    -- only count as finished once the expected backlog has actually arrived
    IF @recv = @precv AND @redone = @predone AND @q = 0 AND @ms > 10000
       AND (@recv - @b0) >= CAST($(MINMB) AS bigint) * 1048576 SET @stable += 1 ELSE SET @stable = 0;
    SELECT @precv = @recv, @predone = @redone;
    WAITFOR DELAY '00:00:00.500';
END;

DECLARE @b_recv bigint, @b_redone bigint, @f_recv bigint, @f_redone bigint,
        @start_ms int, @recv_ms int, @drain_ms int, @peak bigint;
SELECT TOP 1 @b_recv = recv_bytes, @b_redone = redone_bytes FROM dbo.drain_samples WHERE run='$(RUN)' ORDER BY ms;
SELECT TOP 1 @f_recv = recv_bytes, @f_redone = redone_bytes FROM dbo.drain_samples WHERE run='$(RUN)' ORDER BY ms DESC;
SELECT @start_ms = MIN(CASE WHEN redone_bytes > @b_redone THEN ms END),
       @recv_ms  = MIN(CASE WHEN recv_bytes  = @f_recv   THEN ms END),
       @drain_ms = MIN(CASE WHEN redone_bytes = @f_redone THEN ms END),
       @peak = MAX(redo_queue_kb)
FROM dbo.drain_samples WHERE run='$(RUN)';
PRINT CONCAT('DRAIN_SUMMARY|$(RUN)|', (@f_redone-@b_redone)/1048576, '|', (@f_recv-@b_recv)/1048576, '|',
             @start_ms, '|', @recv_ms, '|', @drain_ms, '|', @peak, '|',
             CAST((@f_redone-@b_redone)/1048576.0 / NULLIF((@drain_ms-ISNULL(@start_ms,0))/1000.0,0) AS decimal(10,1)));
Results
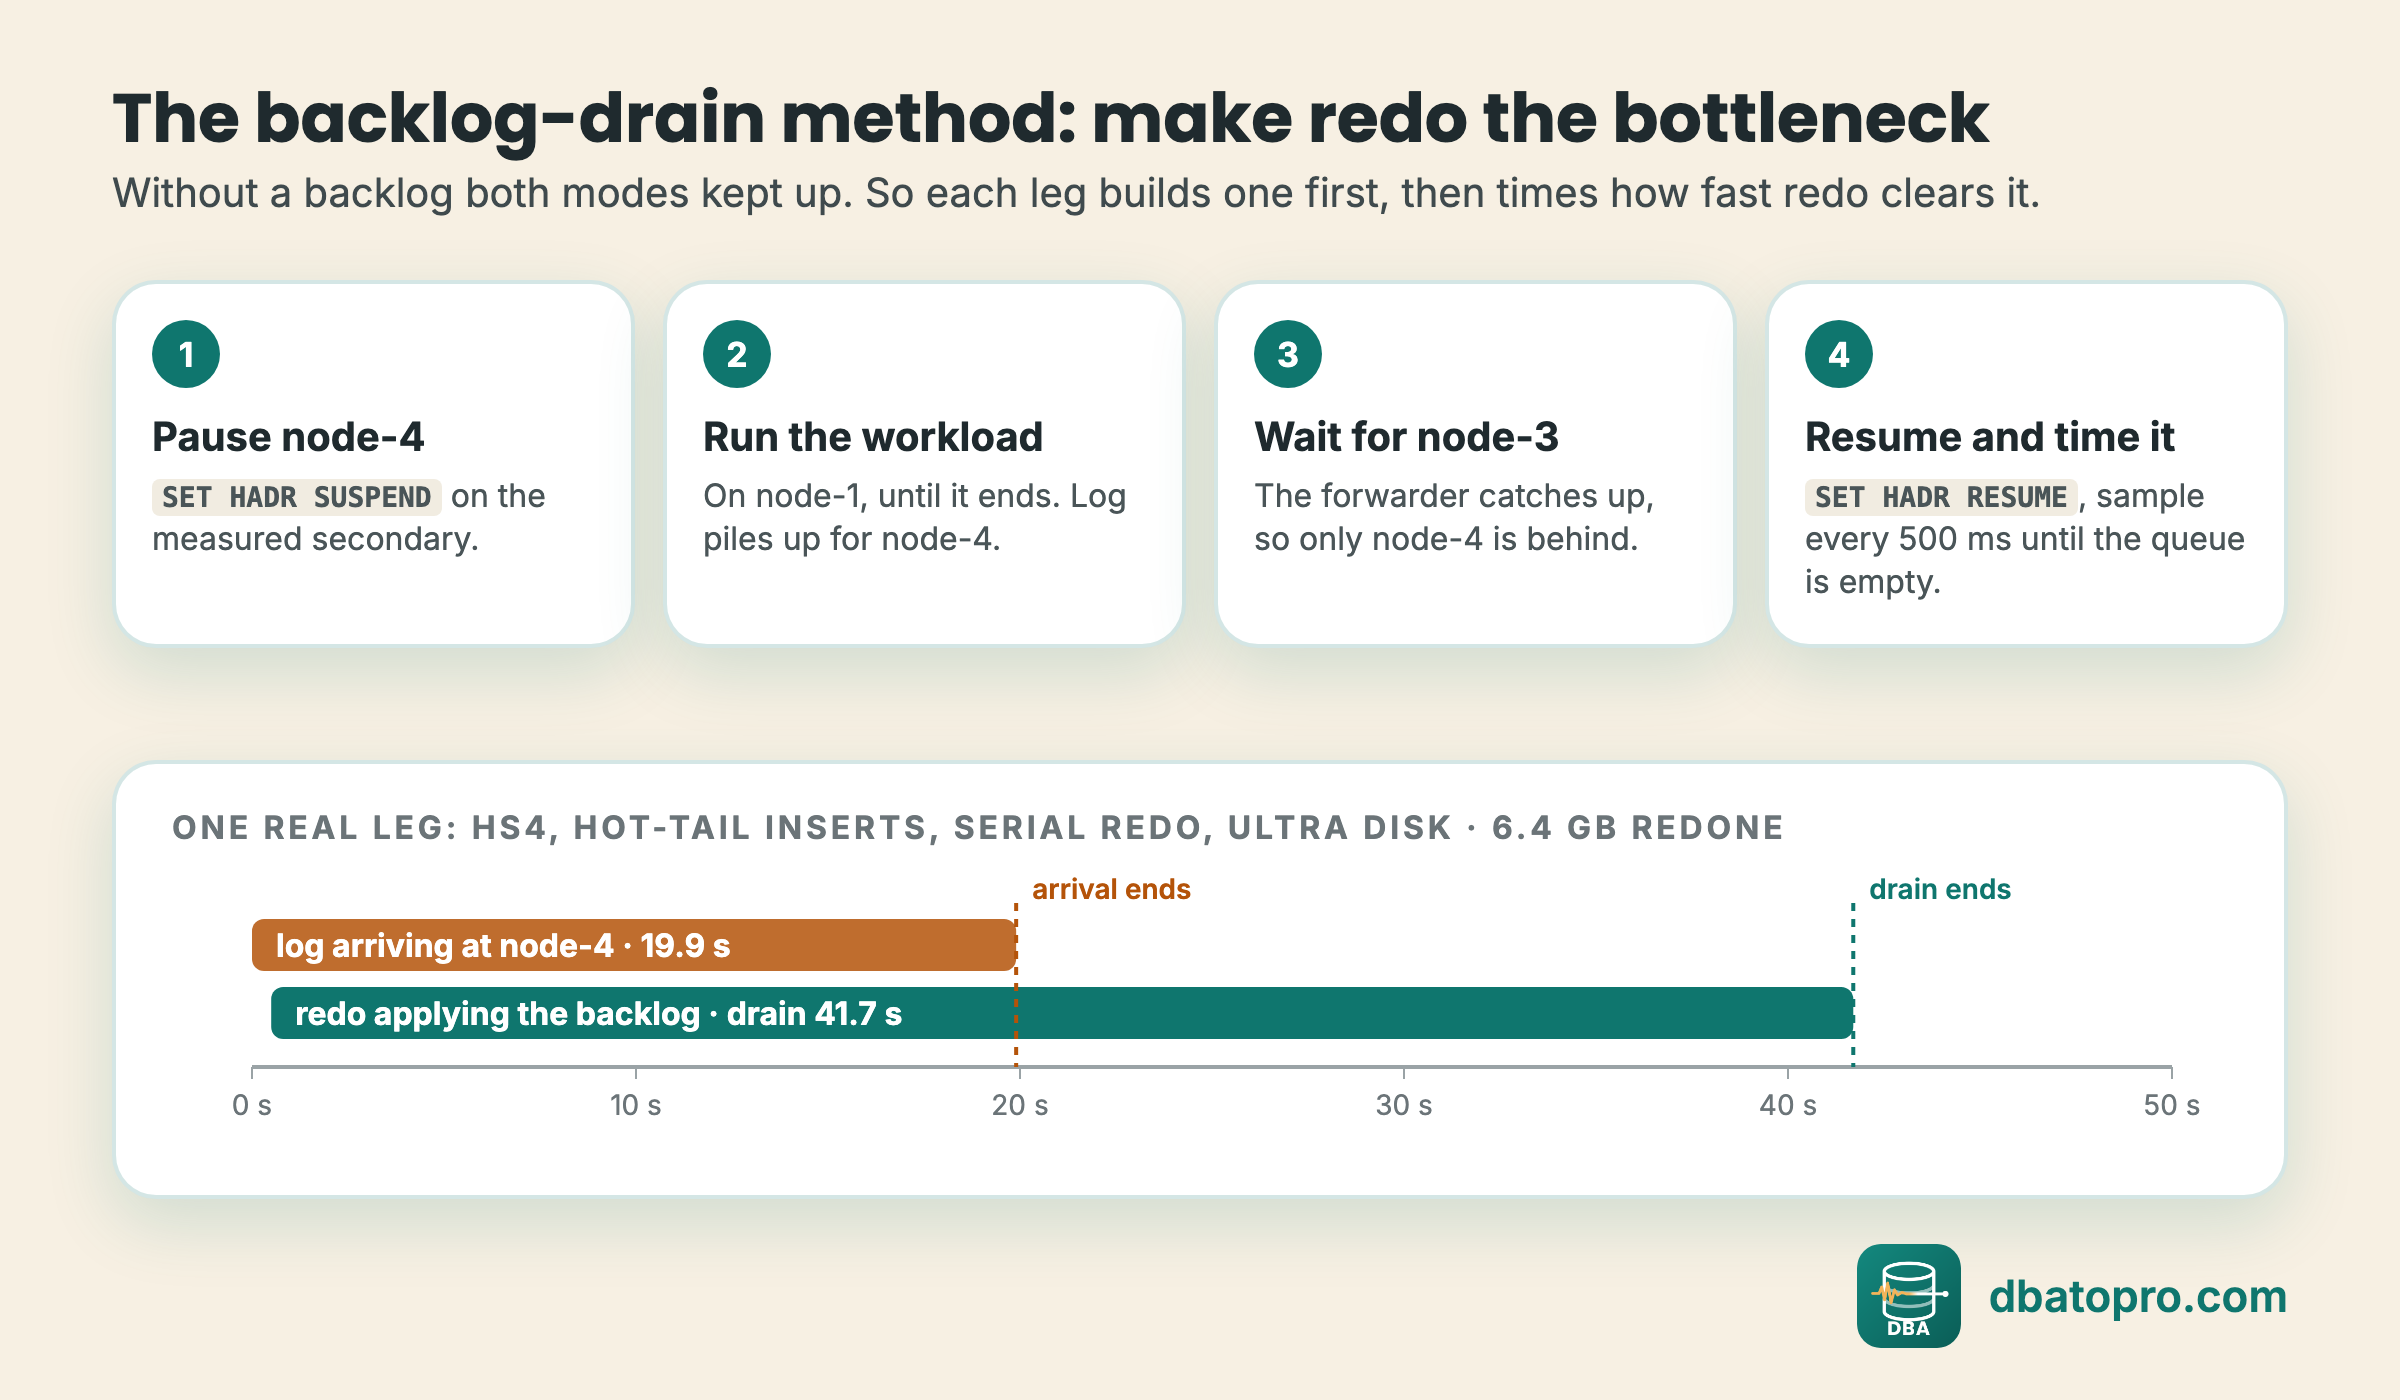
The drain script ends with one line. Leg Hs4 (serial, hot-tail, Ultra Disk):
DRAIN_SUMMARY|Hs4|6437|7322|534|19938|41742|4696520|156.2
-- run | redone MB | received MB | first redo ms | arrival ms | drain ms | peak queue KB | MB/s
Arrival is when the last log byte reached node-4; drain is when the last byte was redone. A leg only shows redo capacity if the queue builds, that is, if drain ends well after arrival.
Full output: results/drain_Hs4__node-4.txt, results/drain_Hp4__node-4.txt
Recommendation
run_leg.shruns the same steps the lab's orchestrator ran, but from one client withsqlcmd. The lab ran them on each node throughaz vm run-command, because port 1433 was blocked from the client. Test the script on your lab before a long campaign.- Ignore the repeated Null value is eliminated by an aggregate warnings in the output: they come from the sampling loop and are harmless.
Step 06: Lab 1 drains on Standard HDD: no serial win
What this step does
Ran scenarios H to M, two legs per mode, on Standard HDD. Order: serial, parallel, parallel, serial, one leg per scenario each time.
Why
Tests whether any workload makes serial redo faster when redo is under pressure.
Run
$ for s in H I J K L M; do ./run_leg.sh ${s}s1 $s; done # then switch mode (step 02) and repeatScript
scripts/30_workload_scenarios_h_m.sh
#!/usr/bin/env bash
# 30_workload_scenarios_h_m.sh
# Workloads for the backlog-drain scenarios. Runs against [dag-redo-lab] on the global primary.
#   H  hot-tail inserts:   60 sessions, single-row inserts on an identity key, DUR seconds
#   I  random-key inserts: 60 sessions, single-row inserts on a GUID key, DUR seconds
#   J  update churn:       40 sessions, updates on a random row of a 100-row table, DUR seconds
#   K  allocation-heavy:   20 sessions x 90 loops of insert 50 x 8,000-byte rows, then delete them
#   L  wide inserts:       32 sessions x 9 loops of 20,000-row INSERT...SELECT into wide_01..16
#   M  bulk insert:        40 sessions x one 100,000-row INSERT...SELECT
# Usage: 30_workload_scenarios_h_m.sh <H|I|J|K|L|M> <RUN> [DUR_S, default 300]
# Connection: SQL_HOST (default localhost), SQL_USER (default SA) and the password in
# SQLCMDPASSWORD. Writes $OUT/run_<RUN>.done with START/END (UTC) and LOGMB, the log
# written during the leg (from sys.dm_io_virtual_file_stats).
set -u
SQLCMD=${SQLCMD:-/opt/mssql-tools18/bin/sqlcmd}
OUT=${OUT:-./results}; mkdir -p "$OUT"
SCN=$1; RUN=$2; DUR=${3:-300}
SQL(){ "$SQLCMD" -S "${SQL_HOST:-localhost}" -U "${SQL_USER:-SA}" -No -C -b -d dag-redo-lab "$@"; }
LOGB(){ SQL -h -1 -W -Q "SET NOCOUNT ON; SELECT num_of_bytes_written FROM sys.dm_io_virtual_file_stats(DB_ID(),2);" | tr -dc 0-9; }

B=$(LOGB)
START=$(date -u +%Y-%m-%dT%H:%M:%SZ)
case $SCN in
  H) for i in $(seq 1 60); do
       SQL -Q "SET NOCOUNT ON; DECLARE @e datetime2=DATEADD(SECOND,$DUR,SYSUTCDATETIME()); WHILE SYSUTCDATETIME()<@e INSERT dbo.hot_tail(payload) VALUES(REPLICATE('x',200));" >/dev/null 2>&1 &
     done ;;
  I) for i in $(seq 1 60); do
       SQL -Q "SET NOCOUNT ON; DECLARE @e datetime2=DATEADD(SECOND,$DUR,SYSUTCDATETIME()); WHILE SYSUTCDATETIME()<@e INSERT dbo.rand_key(payload) VALUES(REPLICATE('x',200));" >/dev/null 2>&1 &
     done ;;
  J) for i in $(seq 1 40); do
       SQL -Q "SET NOCOUNT ON; DECLARE @e datetime2=DATEADD(SECOND,$DUR,SYSUTCDATETIME()), @id int; WHILE SYSUTCDATETIME()<@e BEGIN SET @id=1+ABS(CHECKSUM(NEWID()))%100; UPDATE dbo.churn SET counter+=1, payload=REPLICATE(CHAR(65+@id%26),200) WHERE id=@id; END" >/dev/null 2>&1 &
     done ;;
  K) for i in $(seq 1 20); do
       SQL -Q "SET NOCOUNT ON; DECLARE @n int=0; WHILE @n<90 BEGIN INSERT dbo.alloc_churn(session_n,payload) SELECT TOP(50) $i, REPLICATE('x',8000) FROM dbo.seed_100k; DELETE dbo.alloc_churn WHERE session_n=$i; SET @n+=1; END" >/dev/null 2>&1 &
     done ;;
  L) for i in $(seq 1 32); do
       t=$(printf %02d $(( i % 16 + 1 )))
       SQL -Q "SET NOCOUNT ON; DECLARE @n int=0; WHILE @n<9 BEGIN INSERT dbo.wide_$t(session_n,payload) SELECT TOP(20000) $i, payload FROM dbo.seed_100k; SET @n+=1; END" >/dev/null 2>&1 &
     done ;;
  M) for i in $(seq 1 40); do
       SQL -Q "INSERT dbo.bulk_target (session_n, src_id, payload) SELECT $i, id, payload FROM dbo.seed_100k;" >/dev/null 2>&1 &
     done ;;
  *) echo "Unknown scenario: $SCN" >&2; exit 1 ;;
esac
wait
END=$(date -u +%Y-%m-%dT%H:%M:%SZ)
A=$(LOGB)
echo "RUN=$RUN START=$START END=$END LOGMB=$(( (A-B)/1048576 ))" > "$OUT/run_${RUN}.done"
Results
| Scenario | Serial (s) | Parallel (s) | Reading |
|---|---|---|---|
| H, hot-tail inserts | 167–188 | 143–195 | Tie |
| I, random-key inserts | 273–279 | 45–60 | Parallel 4.5–6.2× |
| J, update churn | 117–144 | 134–168 | Tie |
| K, allocation-heavy | 75–82 | 77–100 | Tie |
| L, wide inserts | 72–74 | 72–91 | Tie |
| M, bulk insert | 54.5–54.7 | 54.1–54.4 | Tie |
Random-key inserts were the only scenario where redo was the bottleneck in both modes: serial redo finished 210 to 225 s after the last log byte arrived and applied about 0.8 MB/s; parallel 3.4 to 4.7 MB/s. In 16 of the other 20 legs redo finished within 1.1 s of arrival: the log, not redo, set the pace.
Cold start: parallel redo stalled in 4 of 13 parallel legs (3 to 10 MB/s while log arrived at about 27 MB/s, then a fast catch-up), all among the first legs after a SQL Server or VM restart. Serial didn't stall in 12 legs.
Full output: results/lab1_drain_h_m.txt
Recommendation
On slow storage, don't expect a serial win, and don't read a tie as a result. The cold-start stall is a pattern worth a dedicated test (restart before every leg, at least three repeats), not proof.
Step 07: Lab 2 drains on Ultra Disk: serial wins hot-tail inserts
What this step does
Ran the same 24 legs on Ultra Disk, then 4 more hot-tail legs per mode in the order parallel, parallel, serial, serial, twice, so each mode had legs right after a restart and later.
Why
With faster disks the backlog grew to about 6.4 GB for hot-tail inserts, big enough to separate the modes.
Run
$ for leg in Hp3 Hp4; do ./run_leg.sh $leg H; done    # parallel; then step 02 to serial
$ for leg in Hs3 Hs4; do ./run_leg.sh $leg H; done
Script
scripts/30_workload_scenarios_h_m.sh
#!/usr/bin/env bash
# 30_workload_scenarios_h_m.sh
# Workloads for the backlog-drain scenarios. Runs against [dag-redo-lab] on the global primary.
#   H  hot-tail inserts:   60 sessions, single-row inserts on an identity key, DUR seconds
#   I  random-key inserts: 60 sessions, single-row inserts on a GUID key, DUR seconds
#   J  update churn:       40 sessions, updates on a random row of a 100-row table, DUR seconds
#   K  allocation-heavy:   20 sessions x 90 loops of insert 50 x 8,000-byte rows, then delete them
#   L  wide inserts:       32 sessions x 9 loops of 20,000-row INSERT...SELECT into wide_01..16
#   M  bulk insert:        40 sessions x one 100,000-row INSERT...SELECT
# Usage: 30_workload_scenarios_h_m.sh <H|I|J|K|L|M> <RUN> [DUR_S, default 300]
# Connection: SQL_HOST (default localhost), SQL_USER (default SA) and the password in
# SQLCMDPASSWORD. Writes $OUT/run_<RUN>.done with START/END (UTC) and LOGMB, the log
# written during the leg (from sys.dm_io_virtual_file_stats).
set -u
SQLCMD=${SQLCMD:-/opt/mssql-tools18/bin/sqlcmd}
OUT=${OUT:-./results}; mkdir -p "$OUT"
SCN=$1; RUN=$2; DUR=${3:-300}
SQL(){ "$SQLCMD" -S "${SQL_HOST:-localhost}" -U "${SQL_USER:-SA}" -No -C -b -d dag-redo-lab "$@"; }
LOGB(){ SQL -h -1 -W -Q "SET NOCOUNT ON; SELECT num_of_bytes_written FROM sys.dm_io_virtual_file_stats(DB_ID(),2);" | tr -dc 0-9; }

B=$(LOGB)
START=$(date -u +%Y-%m-%dT%H:%M:%SZ)
case $SCN in
  H) for i in $(seq 1 60); do
       SQL -Q "SET NOCOUNT ON; DECLARE @e datetime2=DATEADD(SECOND,$DUR,SYSUTCDATETIME()); WHILE SYSUTCDATETIME()<@e INSERT dbo.hot_tail(payload) VALUES(REPLICATE('x',200));" >/dev/null 2>&1 &
     done ;;
  I) for i in $(seq 1 60); do
       SQL -Q "SET NOCOUNT ON; DECLARE @e datetime2=DATEADD(SECOND,$DUR,SYSUTCDATETIME()); WHILE SYSUTCDATETIME()<@e INSERT dbo.rand_key(payload) VALUES(REPLICATE('x',200));" >/dev/null 2>&1 &
     done ;;
  J) for i in $(seq 1 40); do
       SQL -Q "SET NOCOUNT ON; DECLARE @e datetime2=DATEADD(SECOND,$DUR,SYSUTCDATETIME()), @id int; WHILE SYSUTCDATETIME()<@e BEGIN SET @id=1+ABS(CHECKSUM(NEWID()))%100; UPDATE dbo.churn SET counter+=1, payload=REPLICATE(CHAR(65+@id%26),200) WHERE id=@id; END" >/dev/null 2>&1 &
     done ;;
  K) for i in $(seq 1 20); do
       SQL -Q "SET NOCOUNT ON; DECLARE @n int=0; WHILE @n<90 BEGIN INSERT dbo.alloc_churn(session_n,payload) SELECT TOP(50) $i, REPLICATE('x',8000) FROM dbo.seed_100k; DELETE dbo.alloc_churn WHERE session_n=$i; SET @n+=1; END" >/dev/null 2>&1 &
     done ;;
  L) for i in $(seq 1 32); do
       t=$(printf %02d $(( i % 16 + 1 )))
       SQL -Q "SET NOCOUNT ON; DECLARE @n int=0; WHILE @n<9 BEGIN INSERT dbo.wide_$t(session_n,payload) SELECT TOP(20000) $i, payload FROM dbo.seed_100k; SET @n+=1; END" >/dev/null 2>&1 &
     done ;;
  M) for i in $(seq 1 40); do
       SQL -Q "INSERT dbo.bulk_target (session_n, src_id, payload) SELECT $i, id, payload FROM dbo.seed_100k;" >/dev/null 2>&1 &
     done ;;
  *) echo "Unknown scenario: $SCN" >&2; exit 1 ;;
esac
wait
END=$(date -u +%Y-%m-%dT%H:%M:%SZ)
A=$(LOGB)
echo "RUN=$RUN START=$START END=$END LOGMB=$(( (A-B)/1048576 ))" > "$OUT/run_${RUN}.done"
Results
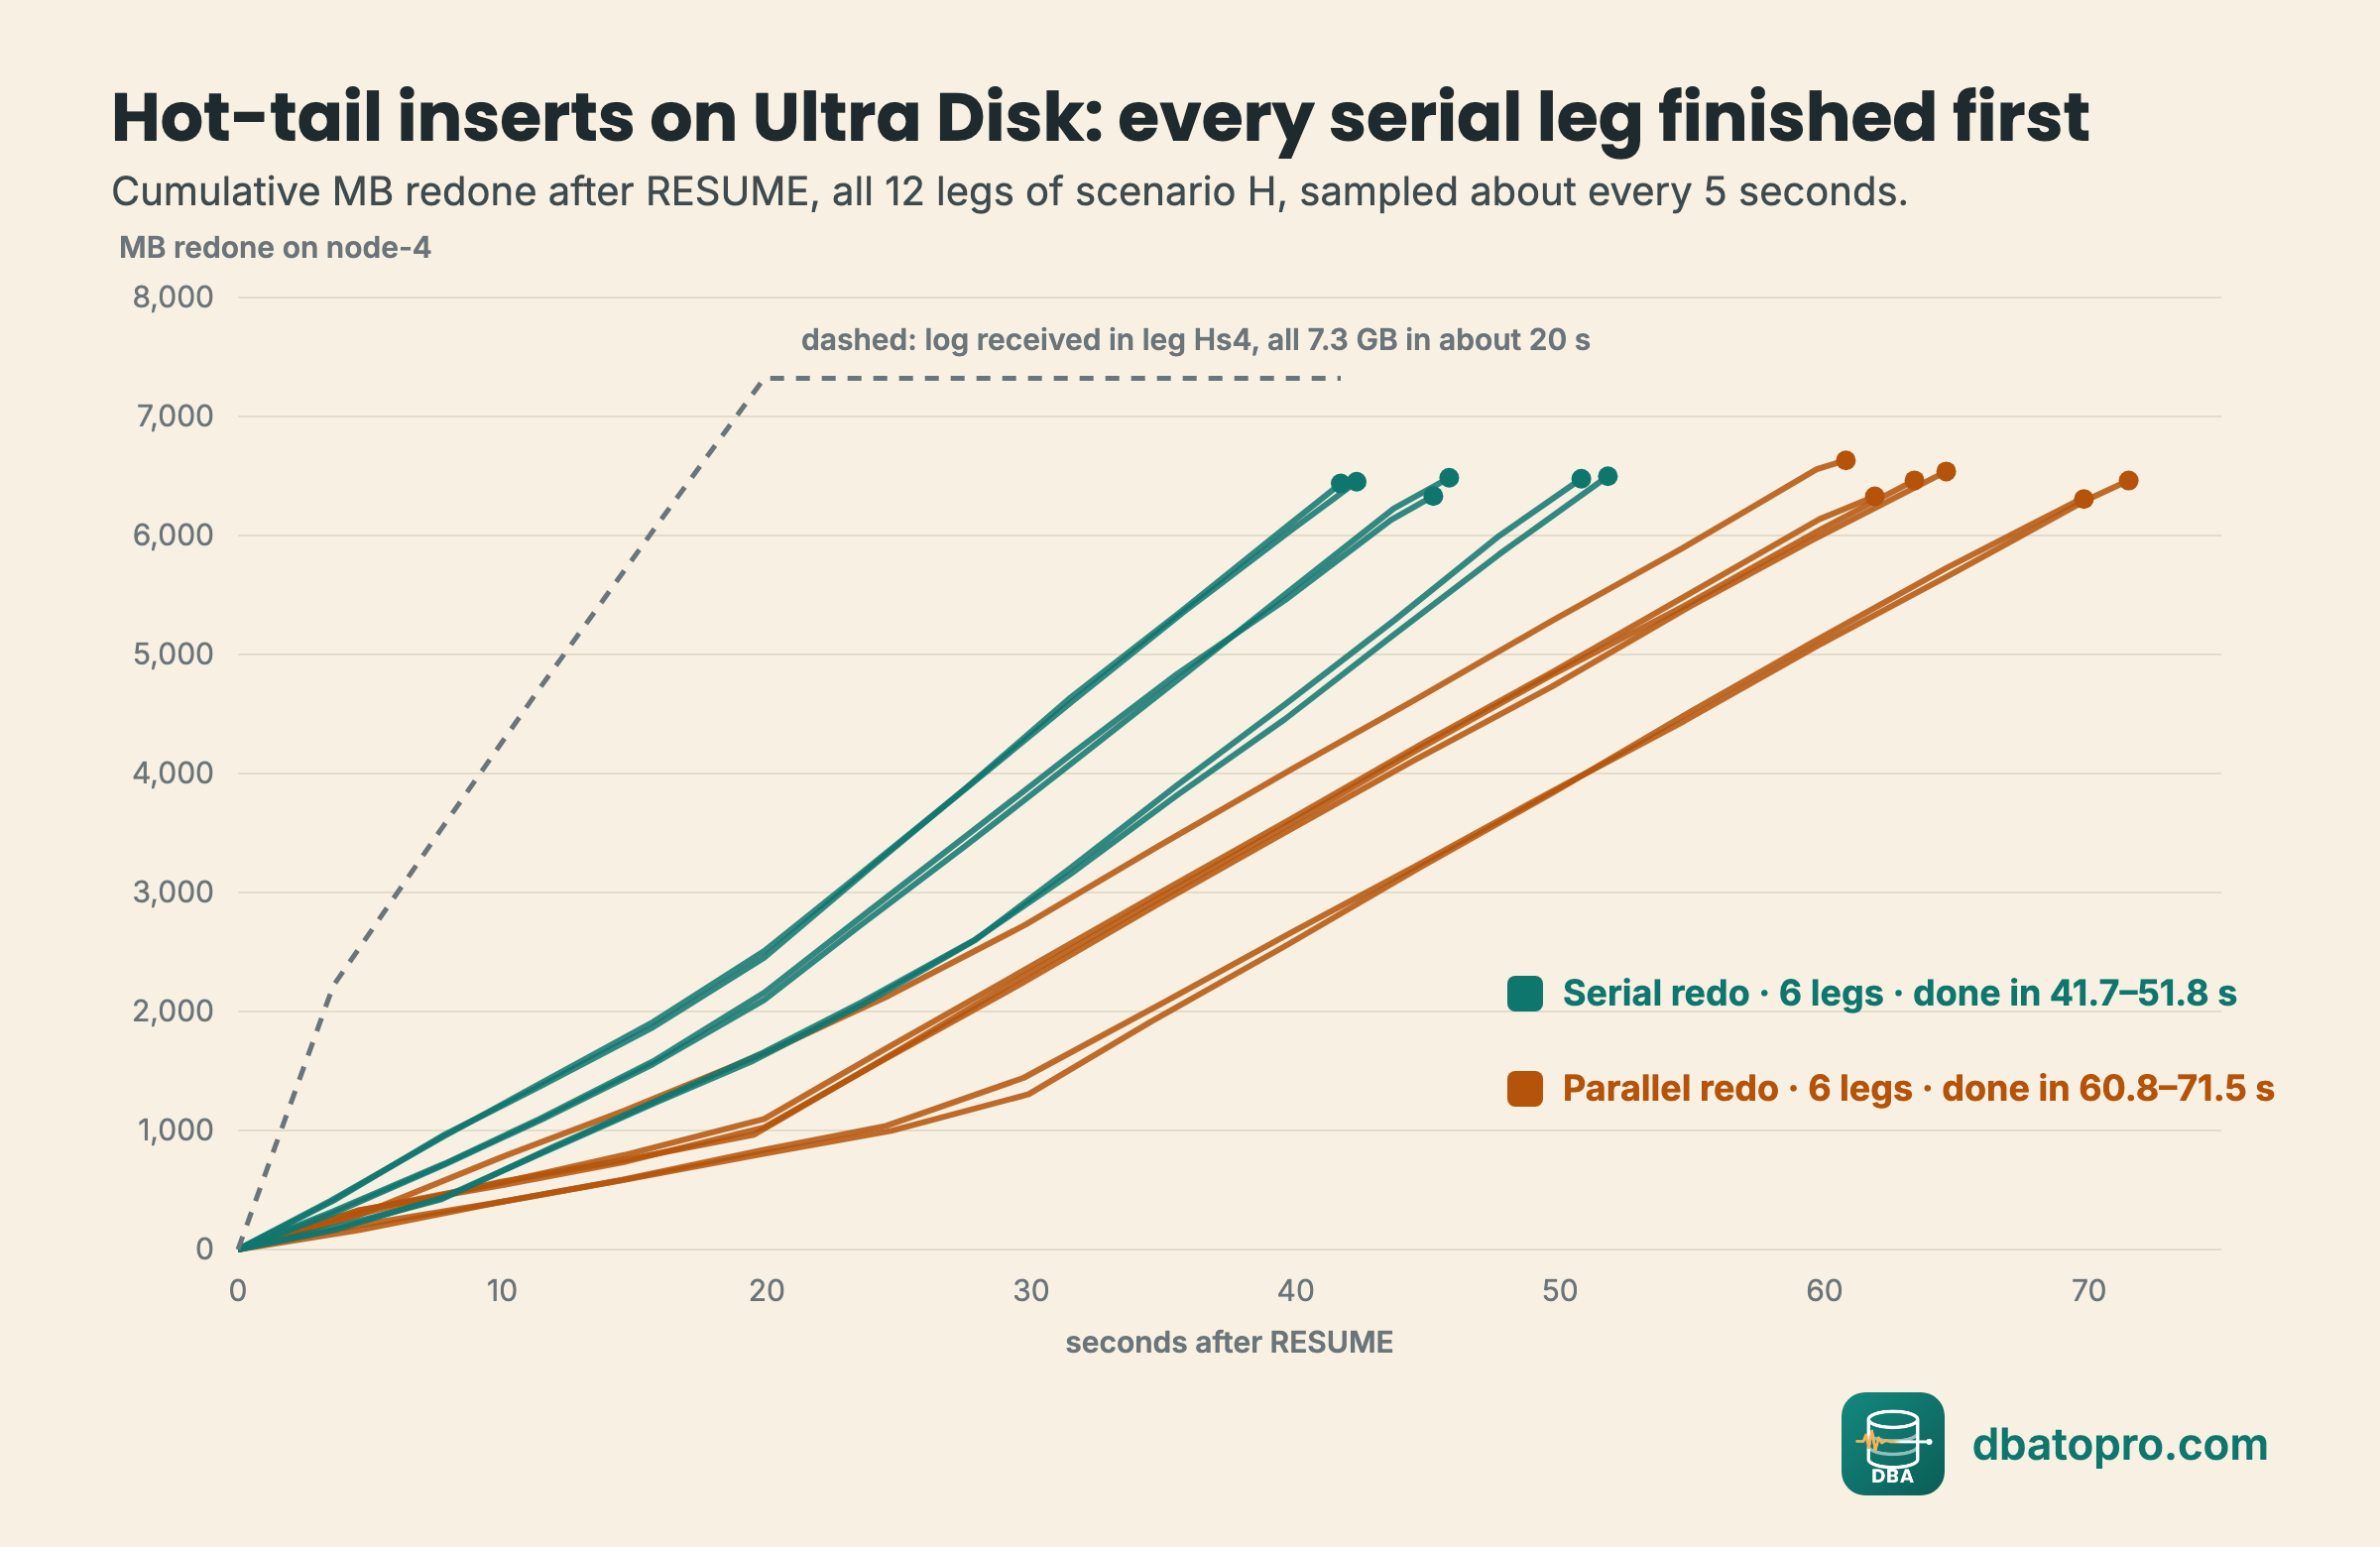
| Leg | Mode | Arrival (s) | Drain (s) | Peak queue (MB) | Redone MB/s |
|---|---|---|---|---|---|
| Hs1 | serial | 28.9 | 51.8 | 4,269 | 125 |
| Hp1 | parallel | 27.7 | 71.5 | 5,987 | 90 |
| Hp2 | parallel | 26.8 | 60.8 | 4,854 | 109 |
| Hs2 | serial | 28.0 | 50.8 | 4,406 | 127 |
| Hp3 | parallel | 29.5 | 69.8 | 5,757 | 90 |
| Hp4 | parallel | 18.9 | 61.9 | 6,084 | 102 |
| Hs3 | serial | 20.5 | 45.8 | 4,959 | 142 |
| Hs4 | serial | 19.9 | 41.7 | 4,586 | 154 |
| Hp5 | parallel | 19.5 | 63.4 | 6,257 | 102 |
| Hp6 | parallel | 19.5 | 64.6 | 6,328 | 101 |
| Hs5 | serial | 19.4 | 45.2 | 4,848 | 140 |
| Hs6 | serial | 19.5 | 42.3 | 4,618 | 152 |
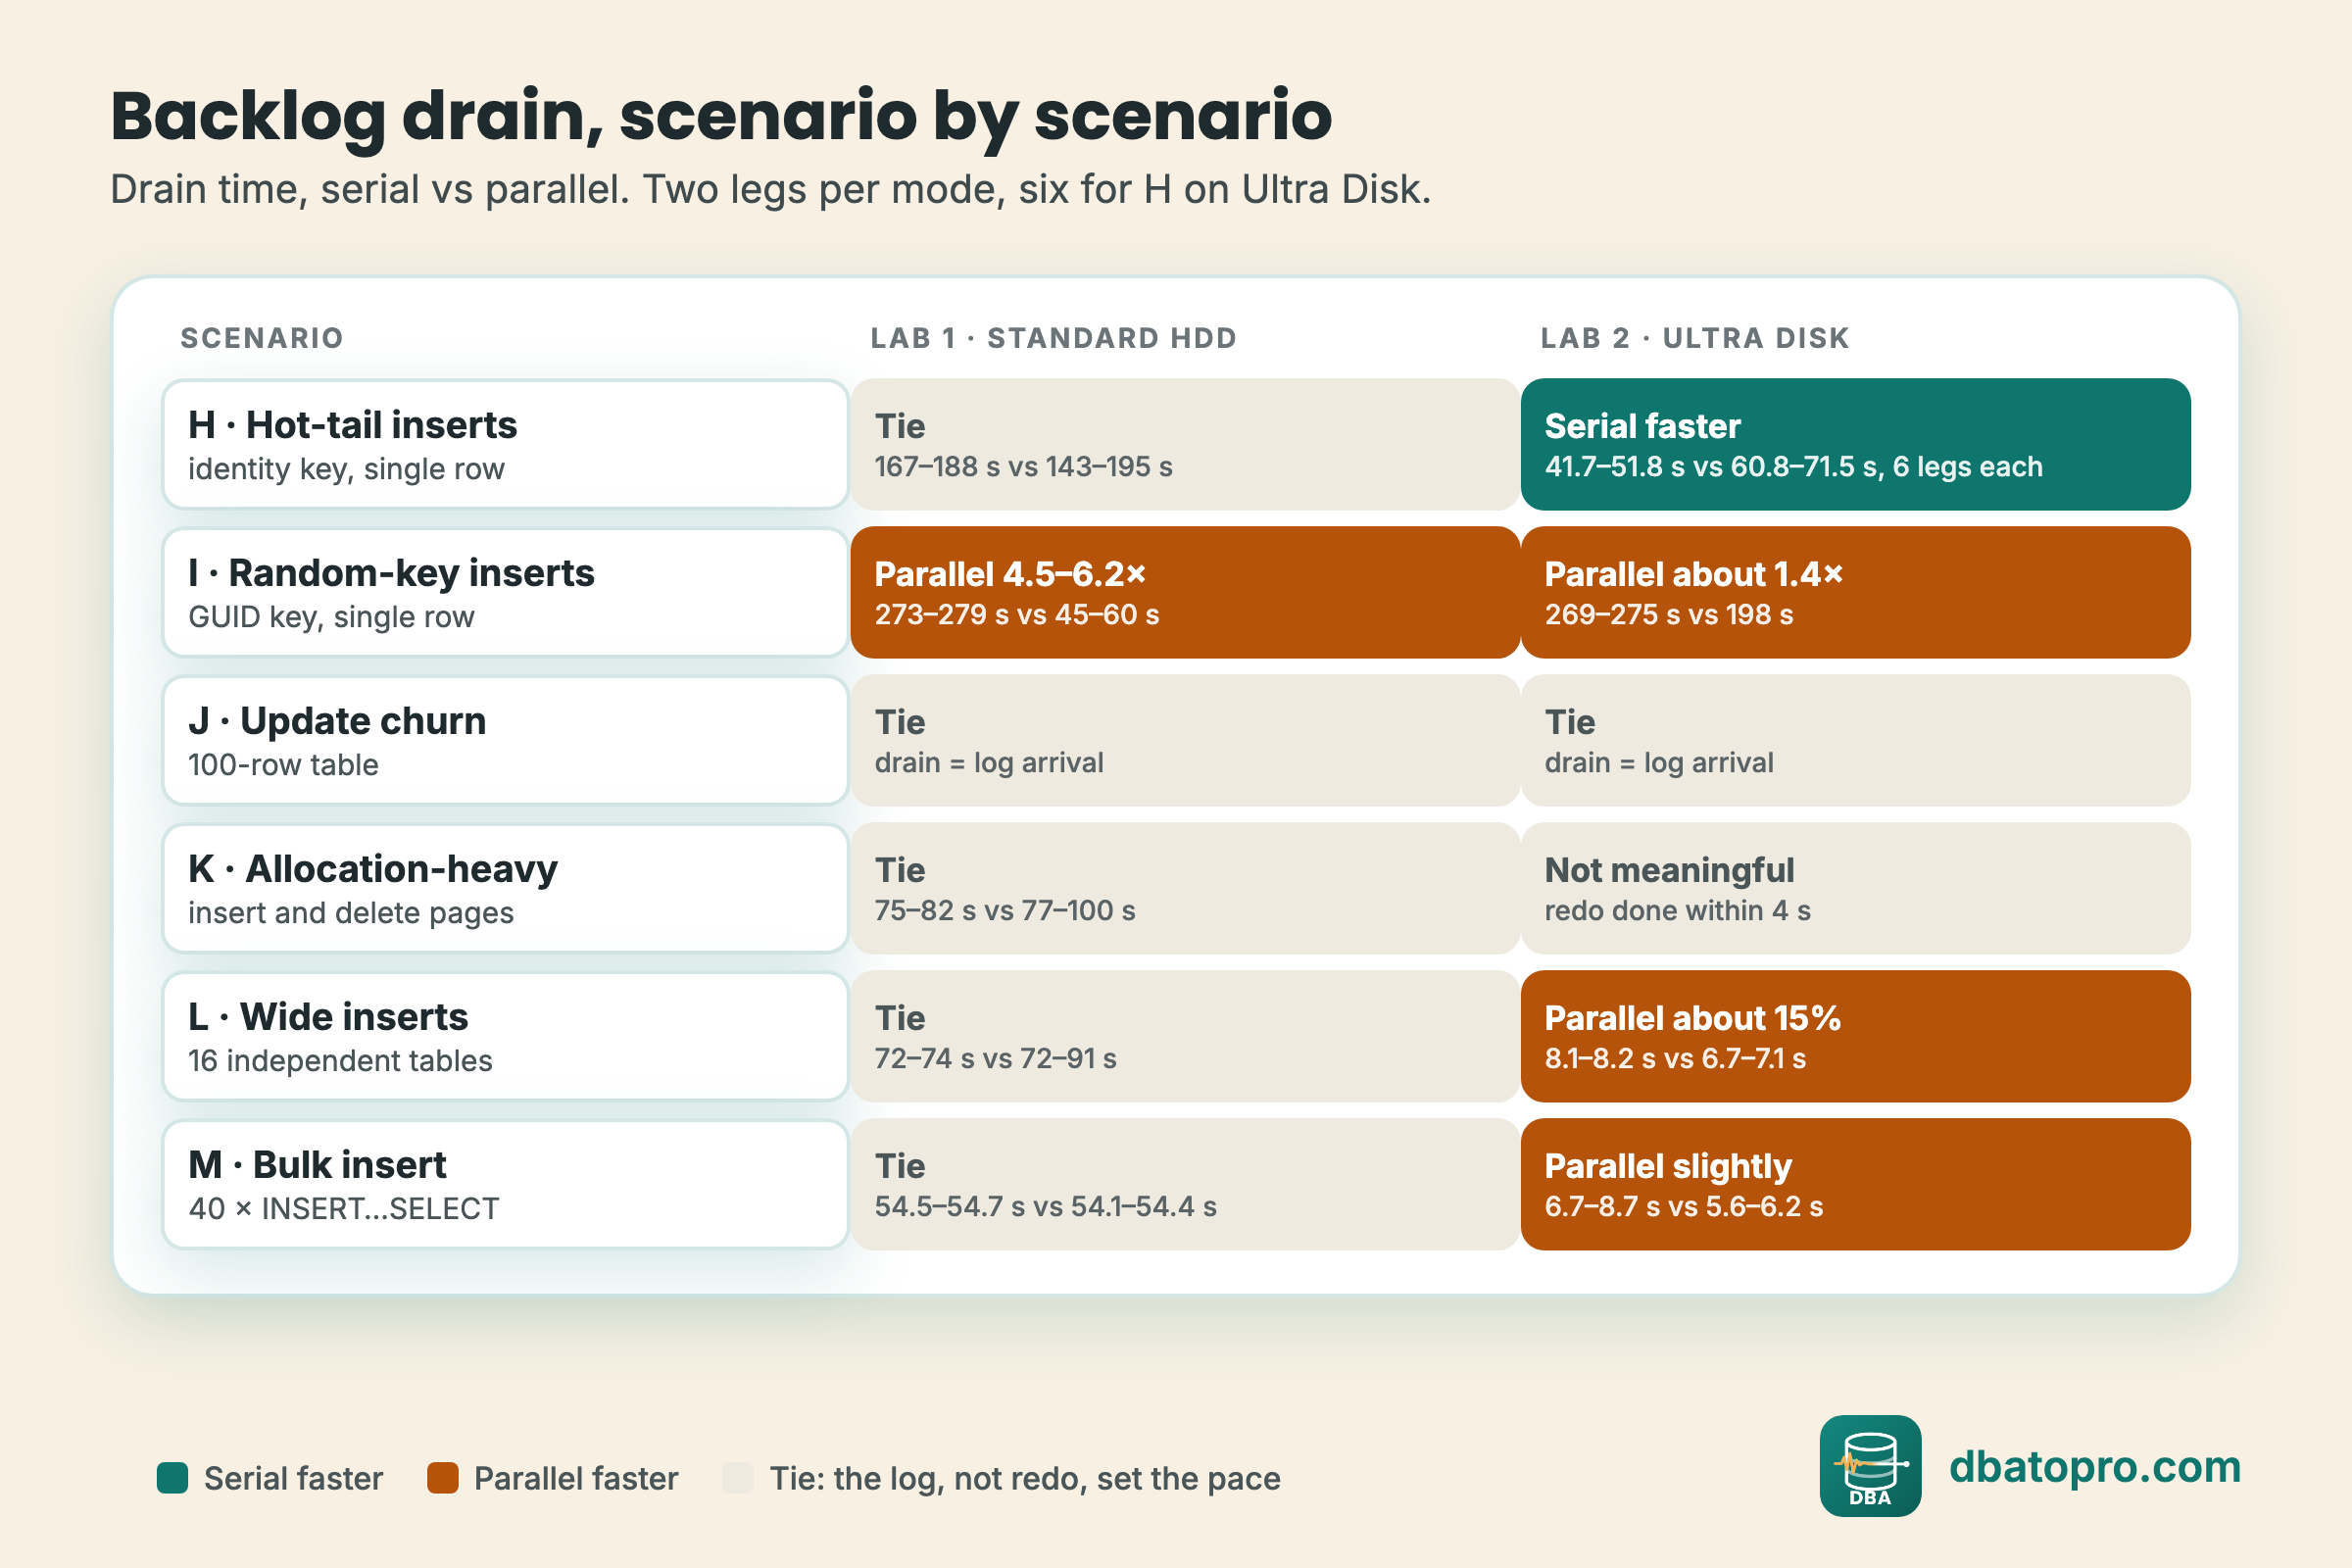
Log arrived in about the same time in both modes. After arrival ended, serial applied 155 to 182 MB/s and parallel 116 to 131 MB/s. Order doesn't explain it: serial took 45.8 and 45.2 s as the first leg after a restart and 41.7 and 42.3 s as the second; parallel 69.8 and 63.4 s first, 61.9 and 64.6 s second.
Elsewhere on Ultra Disk, parallel stayed ahead: random-key inserts about 1.4× (269–275 s vs 198 s), wide inserts about 15%, bulk slightly. Update churn tied (drain = arrival) and allocation-heavy finished within 4 s in every leg.
Full output: results/lab2_drain_h_m.txt, results/lab2_h_curves.txt
Recommendation
Treat the hot-tail result as specific: fast log disk, single-row inserts on an ever-increasing key, and a secondary with 4 redo workers. It is a reason to test serial redo on that workload, not to change the default.
Step 08: Why parallel lost: one dispatching thread
What this step does
Reads the DMV collector samples on node-4 (redo requests, wait and latch statistics, every 1 to 5 s) over the window from the end of each workload to the end of its drain, for all 12 hot-tail legs.
Why
The first guess was that workers block each other on the hot page. Measuring the threads shows where the time really goes.
Run
$ sqlcmd -S "$SECONDARY" -U "$SQL_USER" -No -C -d RedoDiag -i scripts/41_analysis_queries.sql # set @start and @end to the leg's windowScript
scripts/41_analysis_queries.sql
-- 41_analysis_queries.sql
-- Run against a replica's RedoDiag database (live or restored from backup).
-- Every query takes the run's UTC window: @start and @end.

DECLARE @start datetime2 = '<run start utc>', @end datetime2 = '<run end utc>';

-- 1. Redo drain rate: decrease in LOCAL redo_queue_size / drain time (the
--    cleanest comparison is the drain phase, after writes stop). Local rows
--    only: primary-side values for a remote replica can be stale.
SELECT sample_time_utc, redo_queue_size, redo_rate, log_send_queue_size,
       last_hardened_lsn, last_redone_lsn
FROM dbo.hadr_db_replica_states
WHERE is_local = 1 AND sample_time_utc BETWEEN @start AND DATEADD(MINUTE, 30, @end)
ORDER BY sample_time_utc;

-- 2. Catch-up time: first sample after @end where redo_queue_size returns to baseline.
SELECT MIN(sample_time_utc) AS caught_up_utc
FROM dbo.hadr_db_replica_states
WHERE is_local = 1 AND sample_time_utc > @end AND redo_queue_size <= 1024;

-- 3. Cumulative-DMV deltas per run (waits; same pattern for spinlocks/latches/file_stats):
WITH b AS (SELECT * FROM dbo.wait_stats WHERE sample_time_utc =
            (SELECT MAX(sample_time_utc) FROM dbo.wait_stats WHERE sample_time_utc <= @start)),
     e AS (SELECT * FROM dbo.wait_stats WHERE sample_time_utc =
            (SELECT MIN(sample_time_utc) FROM dbo.wait_stats WHERE sample_time_utc >= @end))
SELECT e.wait_type,
       e.waiting_tasks_count - ISNULL(b.waiting_tasks_count,0) AS waits,
       e.wait_time_ms        - ISNULL(b.wait_time_ms,0)        AS wait_ms,
       e.signal_wait_time_ms - ISNULL(b.signal_wait_time_ms,0) AS signal_ms
FROM e LEFT JOIN b ON b.wait_type = e.wait_type
WHERE e.wait_time_ms - ISNULL(b.wait_time_ms,0) > 0
ORDER BY wait_ms DESC;
-- CAUTION: a SQL Server restart inside the window resets these counters.

-- 4. Redo-thread CPU over the run (join os_thread_id to pidstat output):
SELECT sample_time_utc, session_id, command, cpu_time, wait_type, wait_time,
       scheduler_id, os_thread_id, context_switches_count
FROM dbo.redo_requests
WHERE sample_time_utc BETWEEN @start AND @end
ORDER BY sample_time_utc, session_id;

-- 5. Stage lag (run across the four replicas' RedoDiag copies): find the first
--    stage - P1 send, S1 redo, F1 redo/forward, S2 redo - where backlog diverges.
--    Compare log_send_queue_size (send) and redo_queue_size (redo) per node over
--    the same window; never sum underlying-AG and DAG context rows.

-- How to read the results:
--  * hardening/log writes slow + redo queue never gets sustained work -> hardening-limited / inconclusive
--  * redo queue grows while hardened log is available + serial repeatedly drains faster -> reproduced
--  * difference at F1 but not S1 -> forwarding-path diagnostics; on both -> shared redo/workload
--  * build/storage/topology-specific -> state the dependency; do not generalize
--  * mode effect = same node + workload, individual runs plus the MEDIAN, never one peak redo_rate sample
Results
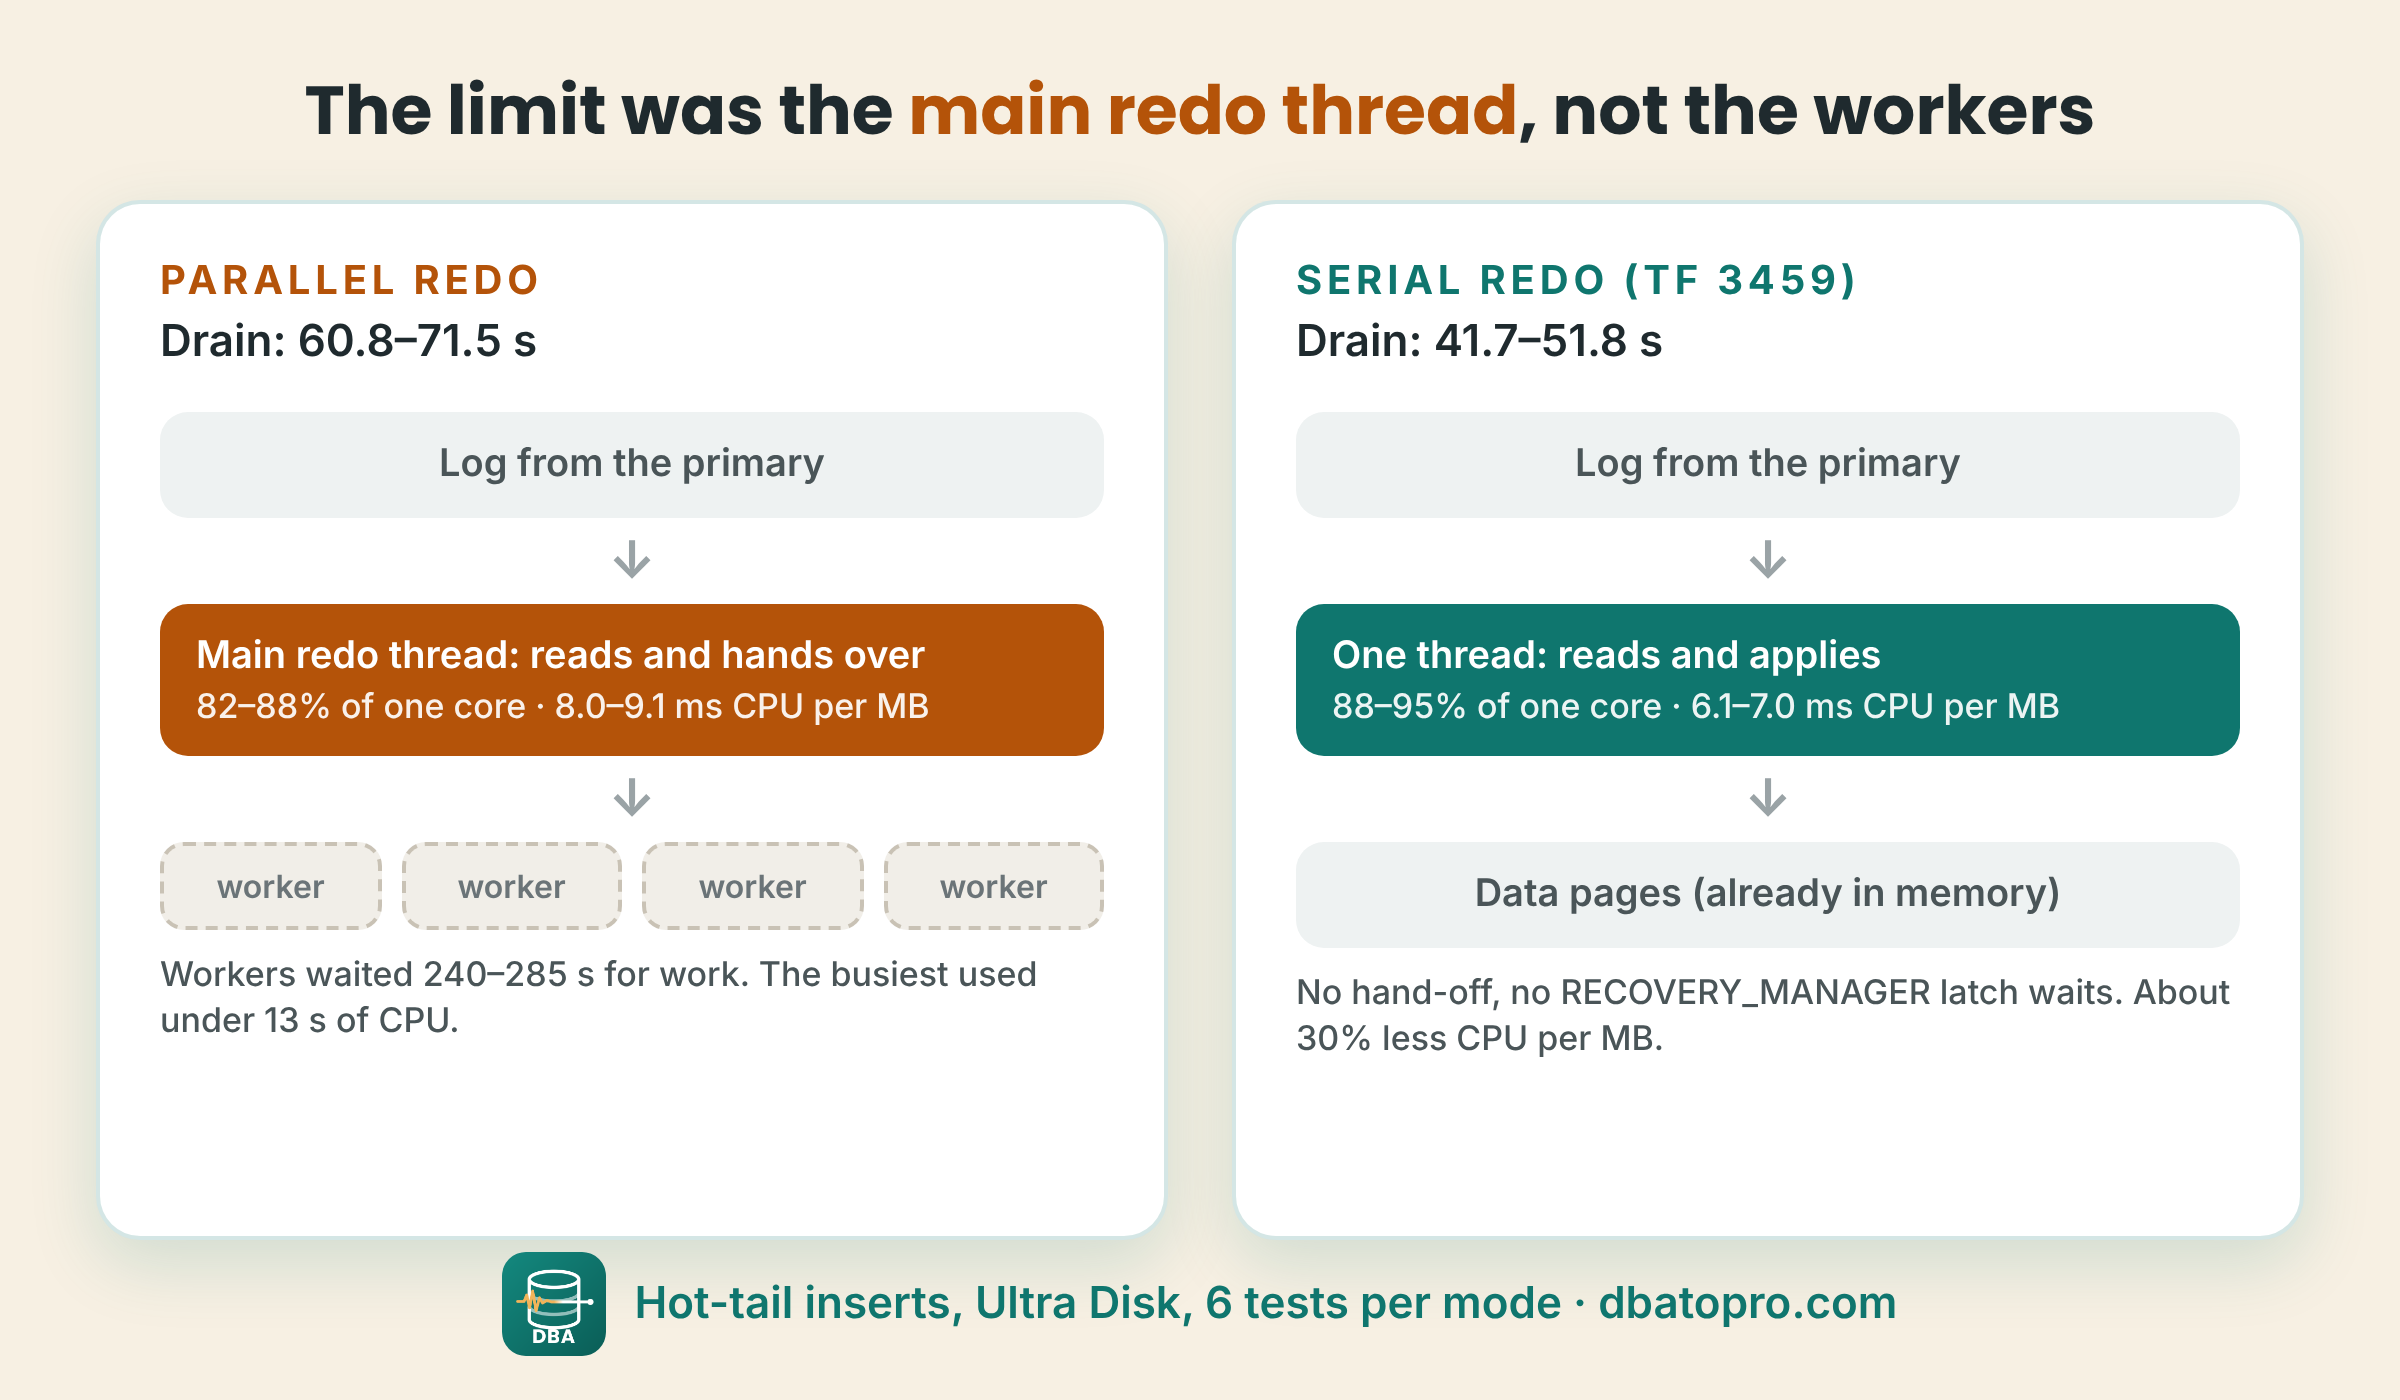
| Measure (6 legs each) | Serial | Parallel |
|---|---|---|
| Drain time | 41.7–51.8 s | 60.8–71.5 s |
| Main redo thread CPU | 39.5–45.7 s | 52.4–58.6 s |
| CPU per MB redone | 6.1–7.0 ms | 8.0–9.1 ms |
| Main thread busy | 88–95% of a core | 82–88% of a core |
| Busiest worker CPU | none | under 13 s |
Workers waiting for work (PARALLEL_REDO_WORKER_WAIT_WORK) | none | 240–285 s |
| Waits between workers | none | 8 s or less |
RECOVERY_MANAGER latch waits | not present | 479,000–546,000 |
Page read waits (PAGEIOLATCH) | 0.2–0.5 s | 1.6–29.3 s |
Each hot-tail record is small and its page is already in memory, so most of the cost is reading the record and handing it over. The parallel main thread spent about 30% more CPU per MB only to read and dispatch than serial redo spent to read and apply, which matches the gap in drain time. Random-key inserts are the opposite: there the workers used 189 to 202 CPU-seconds and waited 145 to 147 s on page reads per leg, real work that spreads well.
Full output: results/lab2_h_dispatcher.txt
Recommendation
- When redo is slow, look at the CPU of the
DB STARTUPthread (query 4 lists every redo thread'scpu_time; the delta over the window is its CPU-seconds), not only at the worker waits. - Not established: which code path in the main thread costs the extra CPU. The
RECOVERY_MANAGERlatch waits, absent in serial mode, point at the hand-off; they don't prove it. - An inference to test, not a result: if one dispatching thread is the limit, more cores and workers on the secondary would not remove it.
Step 09: Test serial redo on one of your secondaries
What this step does
The checks from the post: a baseline of the redo queue and rate, which threads do redo, and the log write latency on the primary. Then trace flag 3459 on one secondary, verified, compared with the baseline, and rolled back if needed.
Why
Hot-tail inserts on a fast log disk were the only case where serial won. These checks tell you whether your workload looks like that before you touch a global trace flag.
Run
$ sqlcmd -S "$SECONDARY" -U "$SQL_USER" -No -C -i scripts/90_production_checks.sql # queries 1 and 2 on the secondary, 3 on the primaryScript
scripts/90_production_checks.sql
-- 90_production_checks.sql
-- The three checks from the post's runbook ("How to test serial redo on a
-- secondary"), for your own servers. They are light; sampling once a minute is
-- fine on a busy server. Save the results on another server, not on the
-- secondary you are measuring.

-- 1. Baseline (run on the secondary, every minute for at least an hour at your busiest time)
SELECT DB_NAME(drs.database_id) AS database_name,
       drs.redo_queue_size,      -- KB received but not yet redone
       drs.redo_rate,            -- average KB/s redone
       drs.log_send_queue_size,  -- KB not yet received
       drs.last_redone_time
FROM sys.dm_hadr_database_replica_states AS drs
WHERE drs.is_local = 1;

-- 2. Which threads do redo for your database (run on the secondary while there is redo work).
--    One row with the command DB STARTUP means single-threaded (serial) redo.
SELECT r.session_id, r.command, r.wait_type, r.wait_time, r.cpu_time
FROM sys.dm_exec_requests AS r
WHERE r.command IN ('DB STARTUP', 'PARALLEL REDO TASK', 'PARALLEL REDO HELP TASK')
  AND r.database_id = DB_ID(N'YourDatabase');

-- 3. Log write latency since the last restart (run on the primary).
--    Around 1 ms, with mostly single-row inserts on an identity key, is the
--    hot-tail zone, where a serial redo test is worth your time.
SELECT DB_NAME(vfs.database_id) AS database_name,
       vfs.num_of_writes,
       CAST(vfs.io_stall_write_ms * 1.0 / NULLIF(vfs.num_of_writes, 0)
            AS decimal(10, 2)) AS avg_log_write_ms
FROM sys.dm_io_virtual_file_stats(NULL, NULL) AS vfs
JOIN sys.master_files AS mf
  ON mf.database_id = vfs.database_id
 AND mf.file_id = vfs.file_id
WHERE mf.type_desc = N'LOG';
Results
Trace flag 3459 is global: it changes redo for every availability group database on that instance. Serial redo was 4.5 to 6 times slower on random-key inserts in this lab. A slower redo means a bigger redo queue and a longer failover. Test on one secondary, never on all of them, and first on a copy of production.
- Baseline: during your busiest hour, sample query 1 every minute for at least an hour. Run query 3 on the primary: around 1 ms, with mostly single-row inserts on an identity key, is the hot-tail zone.
- Apply: in a low-traffic window, on one secondary,
DBCC TRACEON (3459, -1);.DBCC TRACESTATUS (3459);must show Status 1 and Global 1, and query 2 should show only theDB STARTUProw while there is redo work. If redo is still parallel, check the current trace flag documentation and restart SQL Server on that secondary as needed. To keep it after a restart:sudo /opt/mssql/bin/mssql-conf traceflag 3459 on(Linux) or-T3459(Windows). - Compare
redo_queue_sizeandredo_ratewith the baseline at the same hour, for several days. - Roll back if the queue grows past your RTO or failover tests take longer:
DBCC TRACEOFF (3459, -1);, Status 0, and remove it from the startup settings.
Recommendation
These queries are light; sampling once a minute is fine on a busy server. Save the results on another server, not on the secondary you are measuring. Azure SQL Managed Instance and Azure SQL Database don't support trace flag 3459.
Step 99: Clean up
Removes the database from AG A on node-1 (on the forwarder's AG, REMOVE DATABASE fails with Msg 41190), takes the copies on the other nodes out with SET HADR OFF, drops them and the RedoDiag collector database, and turns every secondary back to parallel redo. Then delete the VMs and disks.
$ sqlcmd -S node-1 -U SA -No -C -i scripts/99_cleanup.sql -v ROLE=primary AGNAME="<AG on node-1>"
$ for n in node-2 node-3 node-4; do sqlcmd -S $n -U SA -No -C -i scripts/99_cleanup.sql -v ROLE=secondary AGNAME=x; done
$ sudo /opt/mssql/bin/mssql-conf traceflag 3459 off && sudo systemctl restart mssql-server   # each secondary
scripts/99_cleanup.sql
-- 99_cleanup.sql
-- Removes the lab database and the collector database. Run each part on the node named.
-- Remove the database from the availability group on the global primary only: on the
-- forwarder's AG, REMOVE DATABASE fails with Msg 41190.
-- Usage: sqlcmd ... -i 99_cleanup.sql -v ROLE=primary|forwarder|secondary AGNAME="<AG on node-1>"

IF '$(ROLE)' = 'primary'
BEGIN
    IF DB_ID(N'dag-redo-lab') IS NOT NULL
    BEGIN
        EXEC (N'ALTER AVAILABILITY GROUP [$(AGNAME)] REMOVE DATABASE [dag-redo-lab];');
        EXEC (N'DROP DATABASE [dag-redo-lab];');
    END;
END
ELSE
BEGIN
    -- node-2, node-3 (forwarder) and node-4: take the copy out of the AG, then drop it.
    -- If it is already detached, SET HADR OFF errors harmlessly; the DROP still runs.
    IF DB_ID(N'dag-redo-lab') IS NOT NULL
    BEGIN
        BEGIN TRY EXEC (N'ALTER DATABASE [dag-redo-lab] SET HADR OFF;'); END TRY
        BEGIN CATCH PRINT ERROR_MESSAGE(); END CATCH;
        EXEC (N'DROP DATABASE [dag-redo-lab];');
    END;
END;

-- Every node: the collector database.
IF DB_ID(N'RedoDiag') IS NOT NULL
    EXEC (N'DROP DATABASE RedoDiag;');

-- Every secondary: back to parallel redo (default). Then restart SQL Server:
--   sudo /opt/mssql/bin/mssql-conf traceflag 3459 off && sudo systemctl restart mssql-server
DBCC TRACESTATUS(3459, -1);
Recommendations
- Keep parallel redo as the default. It won or tied in 11 of the 12 scenario and lab pairs, and was up to 6.2 times faster on random-key inserts (steps 06, 07).
- Test serial redo only for a hot-tail profile: a log disk around 1 ms per write, mostly single-row inserts on an ever-increasing key, and a redo queue that grows. Use the checks in step 09, on one secondary.
- Make redo the bottleneck before you compare modes. Without a backlog both modes keep up and every test ties (steps 04, 05).
- Check the storage you really have. Disks deployed as Premium were running as Standard HDD, and that alone hid the result in Lab 1 (step 03).
- Look at the main redo thread's CPU per MB, not only at worker waits, when parallel redo is slow (step 08).
- Repeat and spread the order around restarts. The first serial win was two legs; it only became a result after eight more in an order that ruled out a fresh restart (step 07).
- Treat trace flag 3459 as a global change with a rollback plan: it applies to every AG database on the instance and survives a restart only when set at startup (step 09).
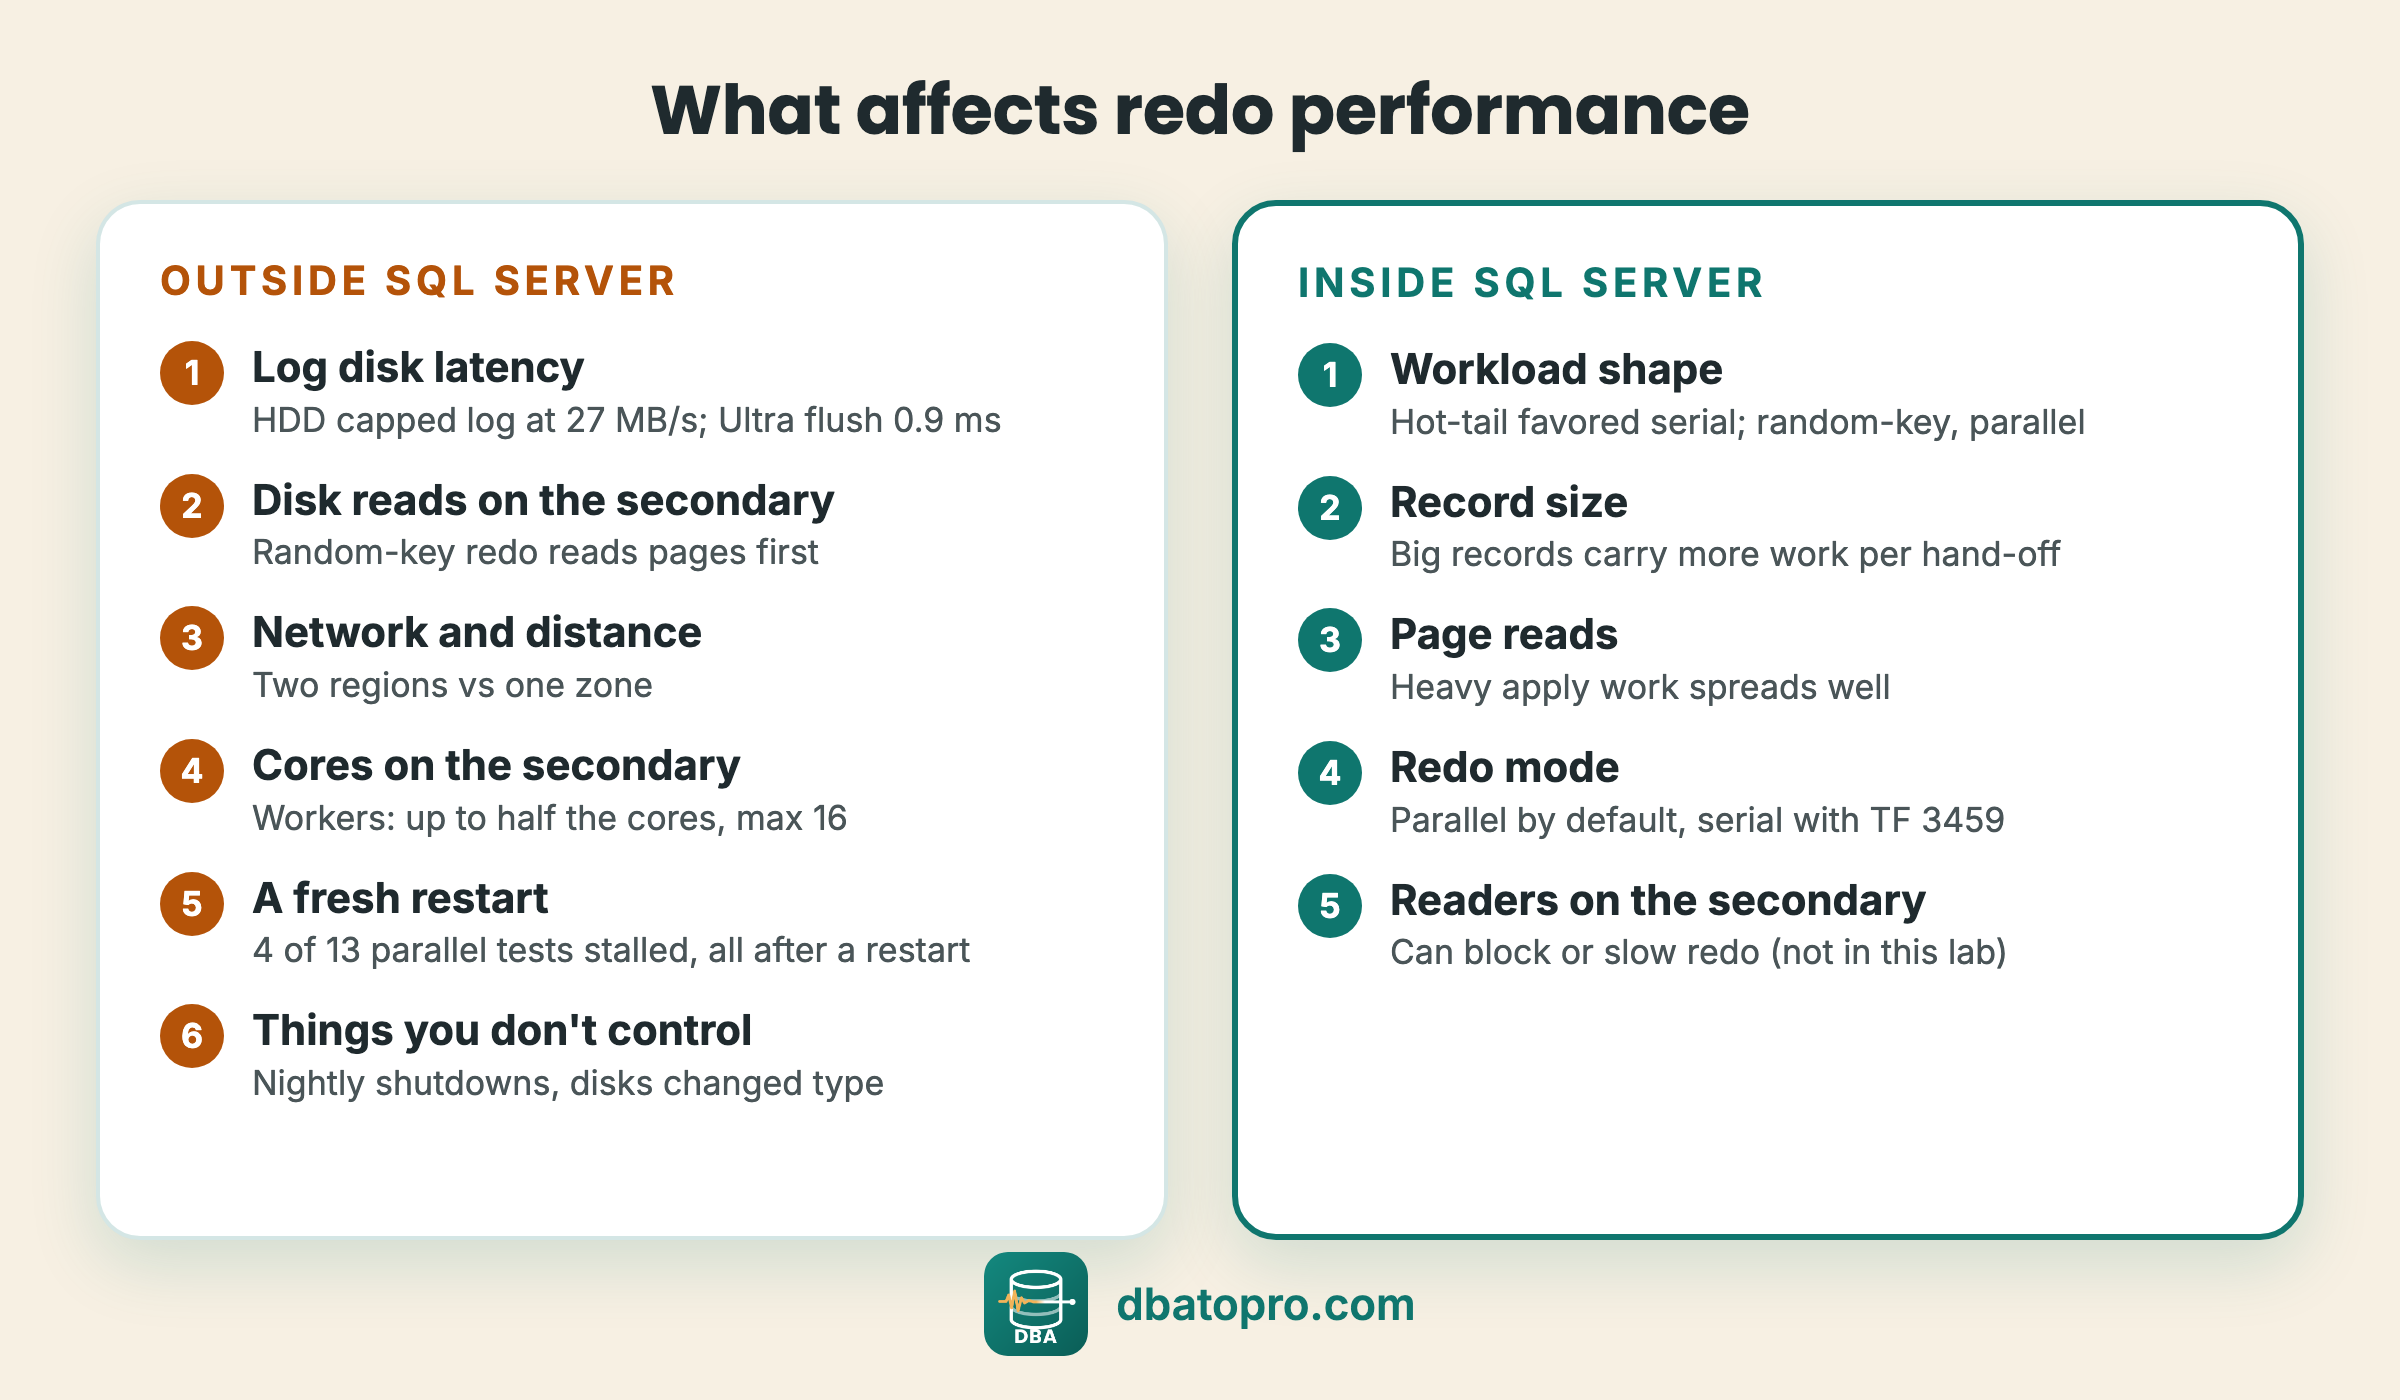
Not covered by this lab
- Larger secondaries: both labs had 8 vCPUs (4 cores) and 4 redo workers on the secondaries. The size of the hot-tail effect with many more cores is not known.
- Ultra Disk across regions: Lab 2 sat in one zone, so log transport was faster than across regions.
- Readers on the secondary: no read workload ran during the tests.
- Released builds and Windows: the lab ran a pre-release build, SQL Server vNext CTP 1.2 on Linux (build 18.0.110.3).
- Azure SQL Managed Instance and Azure SQL Database: trace flag 3459 isn't supported there.
- Repeats: scenarios I to M had two legs per mode; only H had six. Ultra Disk settings were chosen for the lab, not tuned for production.
- The code path behind the extra main-thread CPU: CPU profiles were collected only for runs A to E.